
 Create a clickable Icon
How? Open vorticity on your cellphone with a browser:
Settings - Add to start screen. Ready.
How to navigate vorticity.de?
vorticity.de is basically one single browsable file (i.e. scrollable using the scroll bar)
with only a few extra files. To make navigation easier, most items can be invoked using
different approaches. All clickable buttons, charts or titles offer a context sensitive
on-mouse-over help-text.
Pulldown-Menu

The classical Pulldown-Menu offers direct links to all issues ('anchor'). The Pulldown-Menu is very detailled
with many submenus and even the main intros are clickable.
A very quick and direct-to navigation offers the
3-column MAIN-Menu
which offers links to all topics of vorticity.de.
After start-up of vorticity.de there are some thumbnails on top. From left-to-right a navigatable globe
offering Radio stations worldwide. In the middle a thumbnail linking to the University Madison Wisconsin
Hurricane Watch website and offering other links for Hurricane Monitoring.

 This 'hovering' button on the right always jumps directly from the HELP-website to the MAIN-website.
The HELP-website can easily be identified by its blue background whereas the MAIN-website has a black background.
This 'hovering' button on the right always jumps directly from the HELP-website to the MAIN-website.
The HELP-website can easily be identified by its blue background whereas the MAIN-website has a black background.
 This icon jumps to the HELP-Menu on this website, which has the same structure as the identical 3-column MAIN-Menu,
but offers explanations to the topics.
This icon jumps to the HELP-Menu on this website, which has the same structure as the identical 3-column MAIN-Menu,
but offers explanations to the topics.
Links in vorticity are typically opened in new tags which make it easier to compare different issues.
There is the danger that too many open tags might become slightly confusing. It's then recommended
to close unwanted tags, fastest with browser-specific hotkey, e.g. Ctrl-W for Chrome and Firefox.
This is the HELP website - easy to identify by its blue background - with
the same structure as the MAIN website, but image examples and explanations only.
 MSLP Analysis
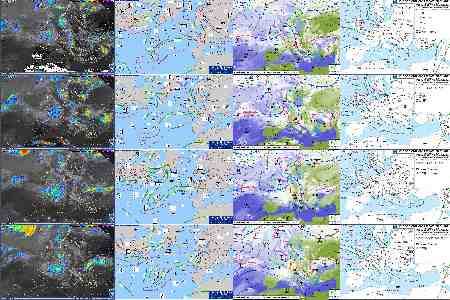
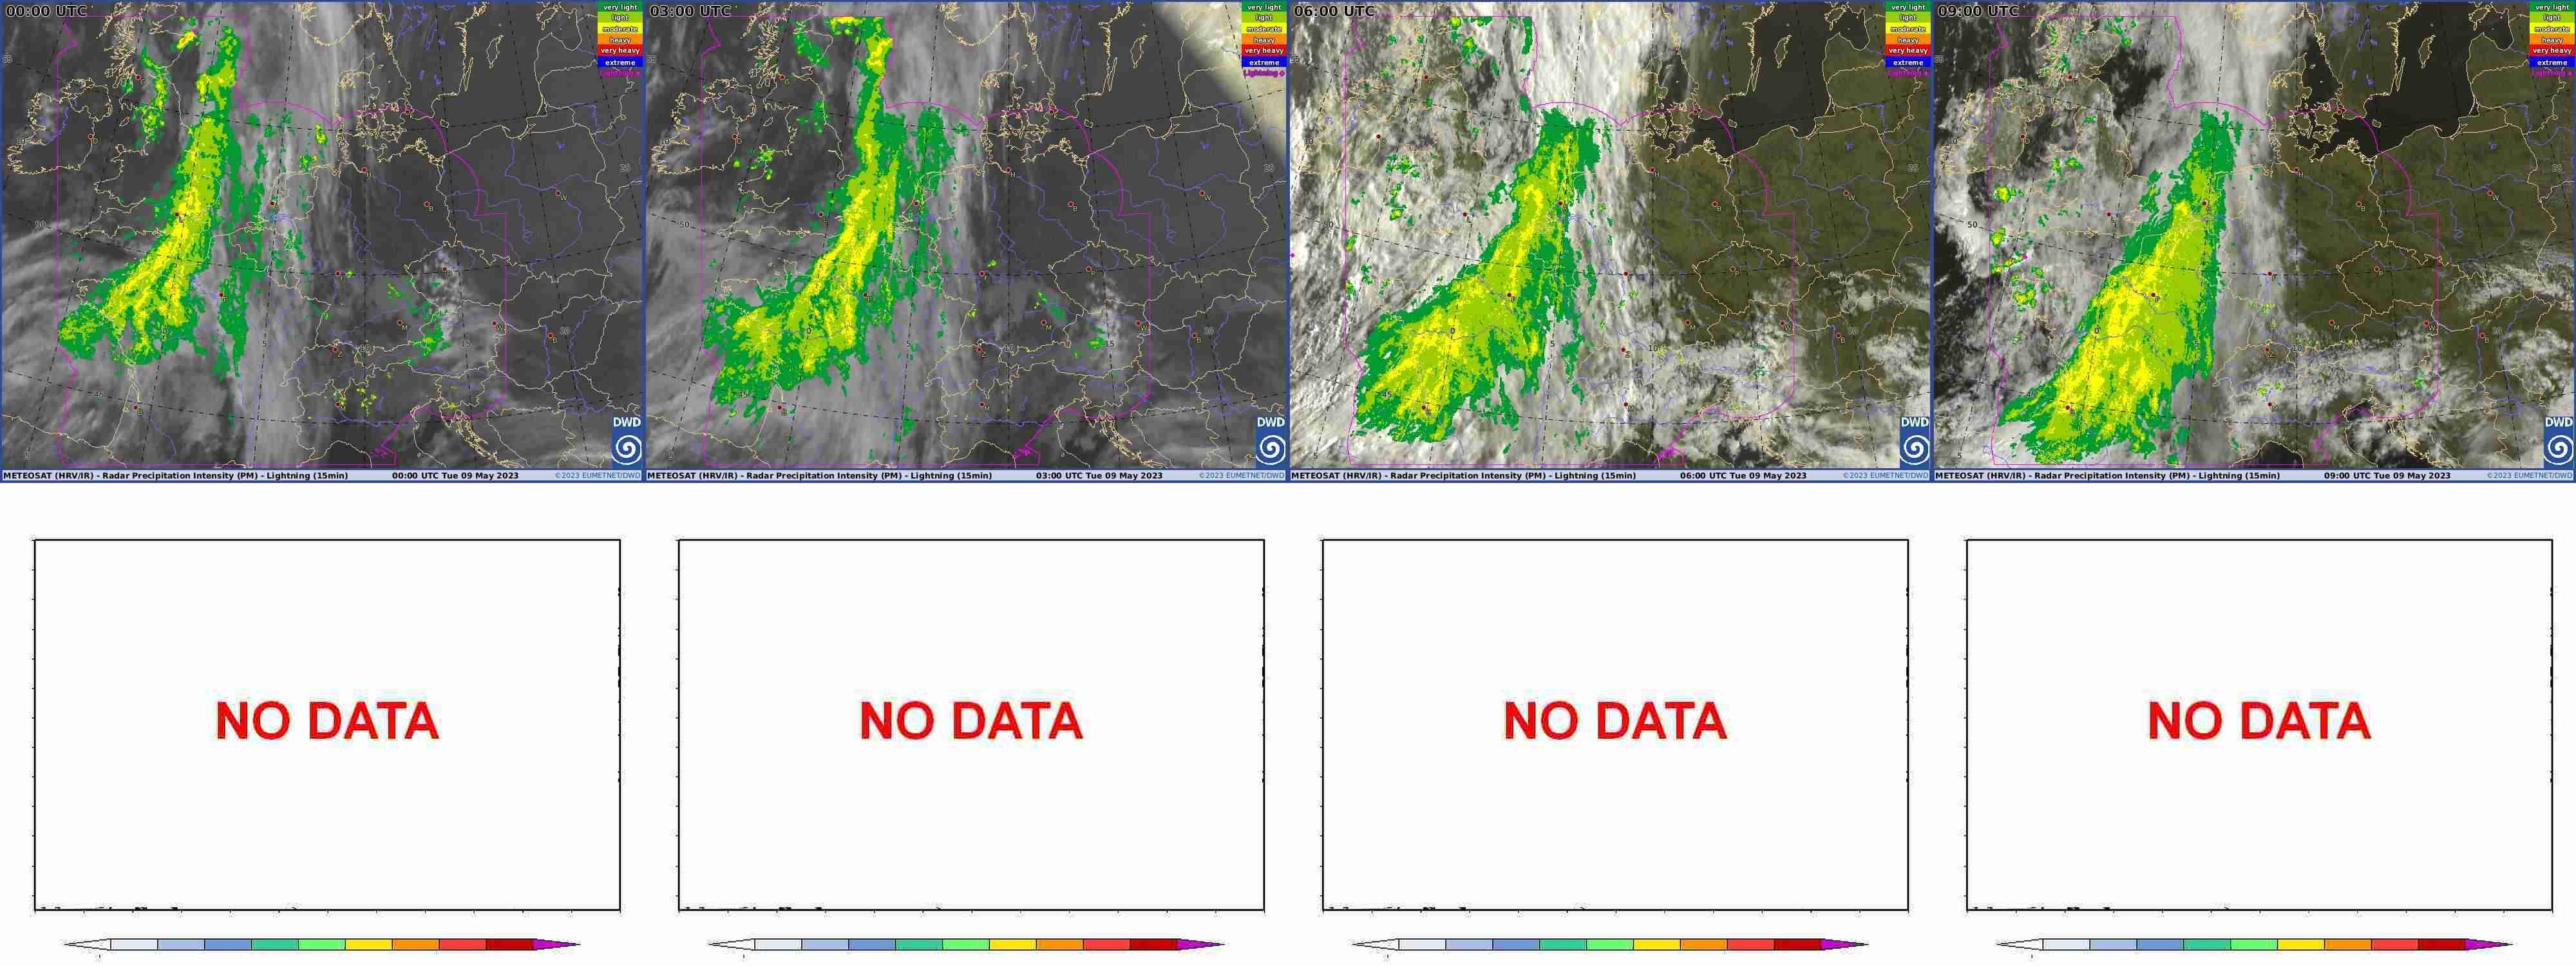
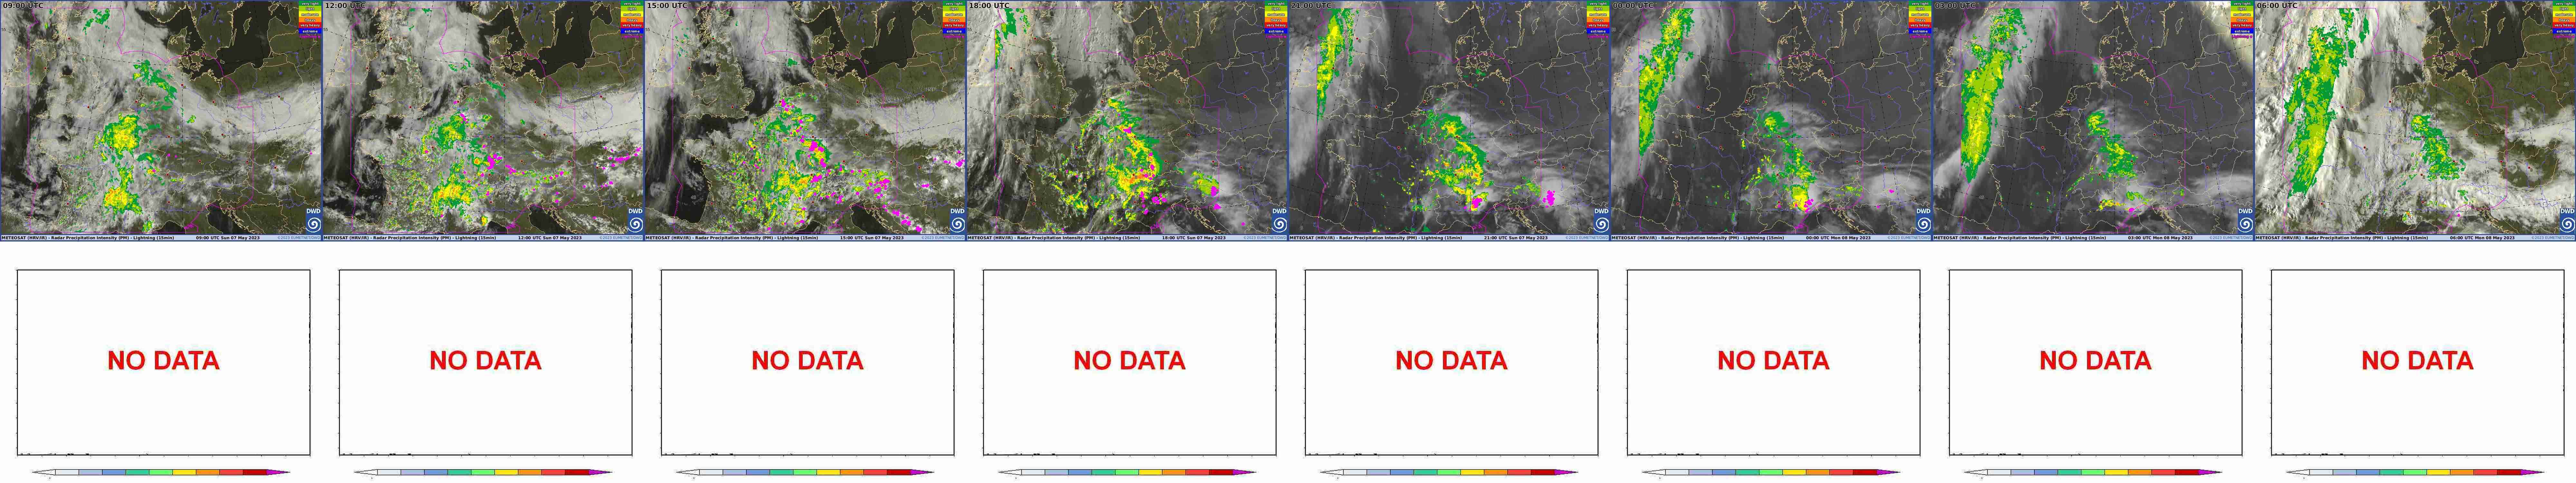
 Analysis SAT LTNG RADAR


○ Left mit SAT / RADAR / LTNG
○ Center RADAR Composite DEU
○ Right with RADAR Composite EUR
✔ Charts of last week?
Archive
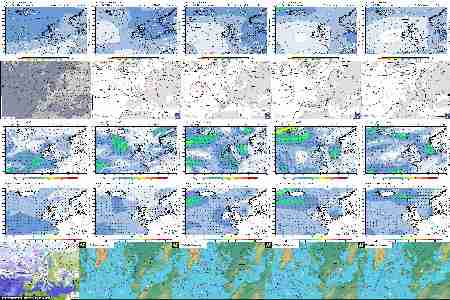
The Arrays below show the last 4 / 8 VALID TIMES (00,03...21Z) and allow to evaluate the development of
the general weather situation during the past 12 and 24 hours, respectively.


These Charts offer information to the following issues:
✔ Current weather situation.
✔ Current SAT Image. Radar-Composite. Fronts.
✔ Synoptic development during the past 24 hours?
✔ 8-Chart-Arrays of last week see also
Archive
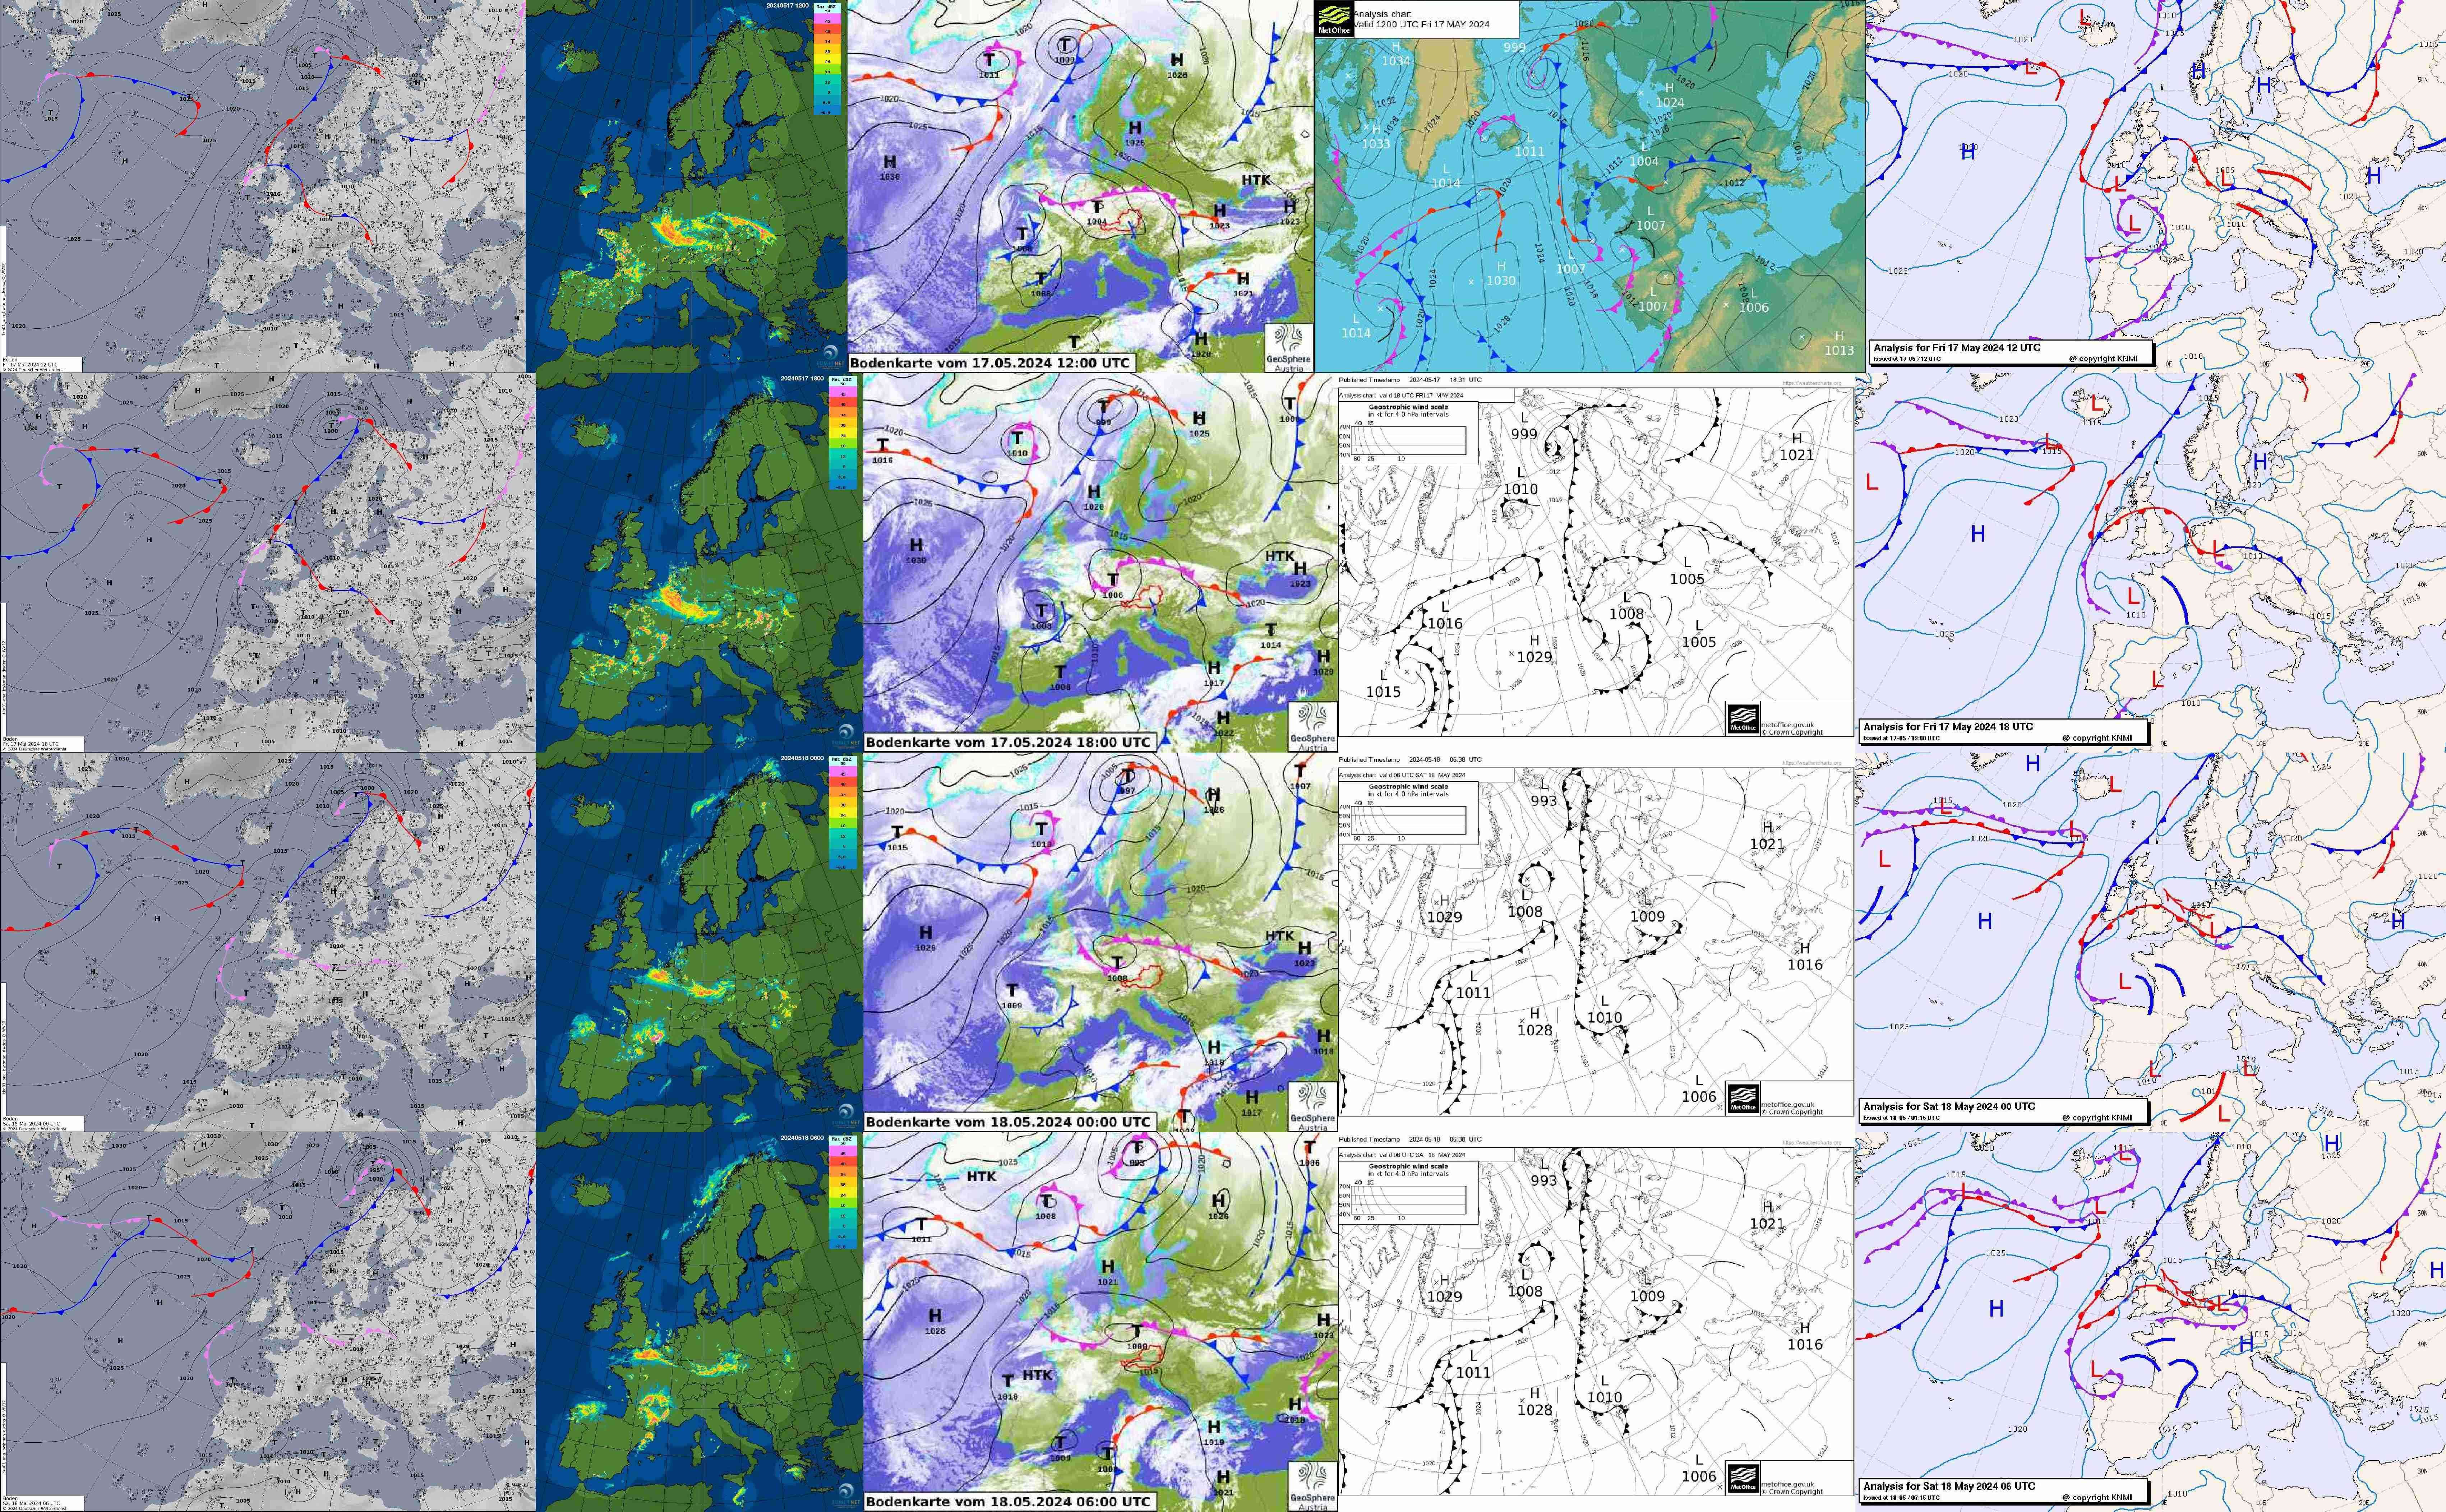
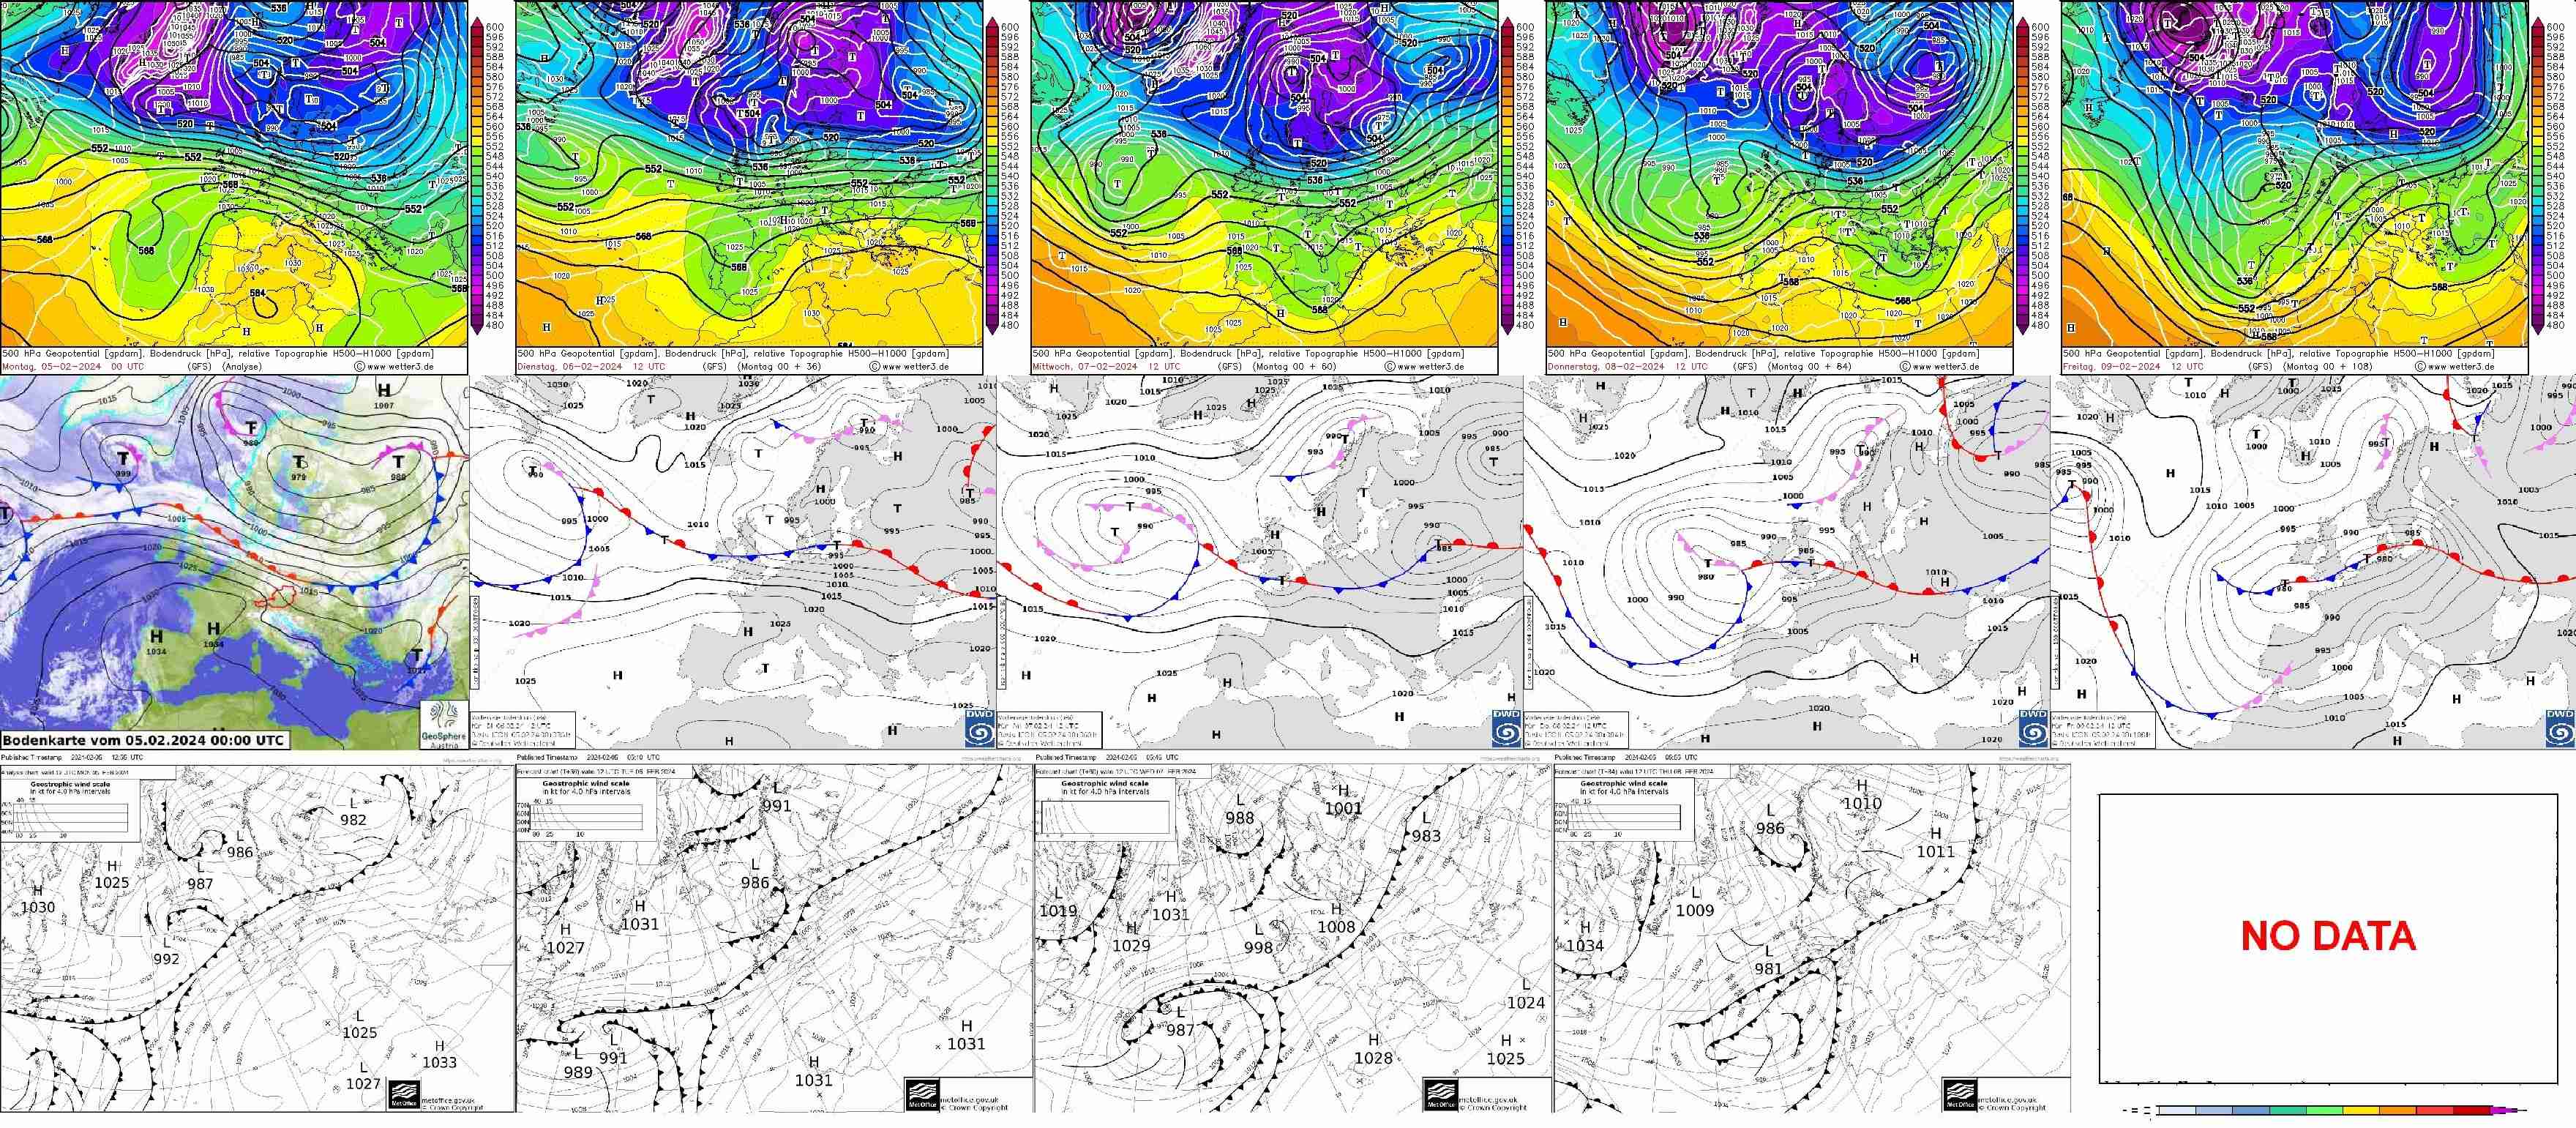
 Comparison Analysis DE-AT-UK-NL
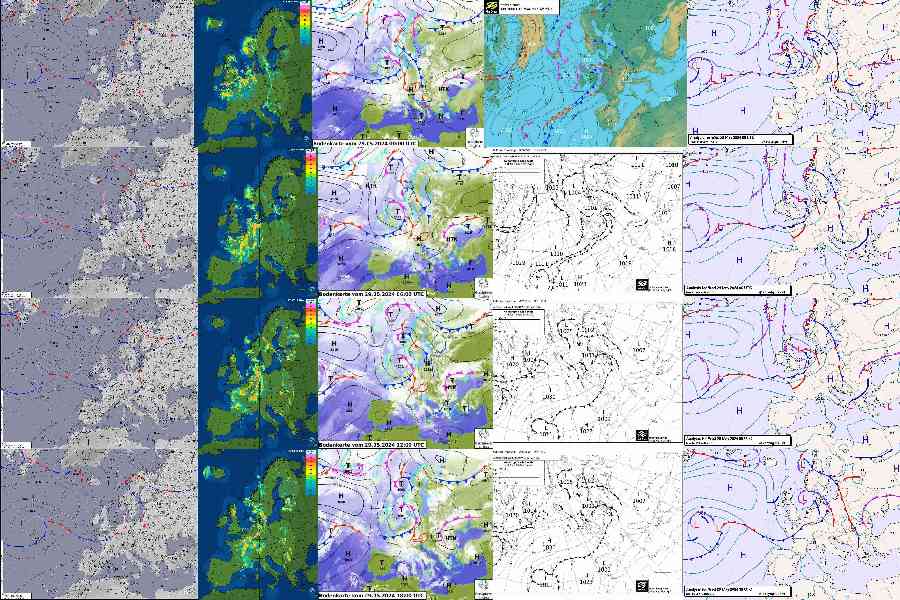
MSLP Analysis DWD ZAMG UKM KNM
VALID TIMES 00/06/12/18UTC
✔ Current MSLP Analysis Nort Atlantic / Europe?
✔ SAT Image? Radar-Composite Europe? Fronts?
✔ Comparison Analysis DWD UKMO ZAMG KNMI?
✔ Synoptic development past 24 hours?
This Array allows the Comparison of DWD, ZAMG, UKMO and KNMI Analysis.
Shown are 00/06/12/18 UTC VALID TIMES with the latest available Analysis in the bottom row.
 Direct links to Analysis worldwide from various National MET Services.
 Here are self-explanatory links to websites with Hydrographical Data (Tides, Water Temperatures SST, Aerosol (Dust), Air Quality, Risk of Forest Fire)
Earthquakes, Lightning Data and Space Weather)
Here are self-explanatory links to websites with Hydrographical Data (Tides, Water Temperatures SST, Aerosol (Dust), Air Quality, Risk of Forest Fire)
Earthquakes, Lightning Data and Space Weather)
 Roshydromet Hydrometcenter
PUTIN, STOP YOUR WAR!
STOP PUTIN'S WAR!
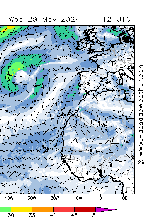
These are very intuitive charts (color shading) for the North Atlantic, Europe and Northern Polar Region.
MSLP Analysis with SAT Image Overlay is issued 06 UTC and the 500 hPa ABTOP at 00 UTC only.
The MSLP Analysis for the same region is issued at 00, 06, 12 and 18 UTC and quite quickly available,
mostly less than two hours after VALID TIME. These charts are directly linked to Roshydromet so no
download or processing delay.
The 10-to-10-Day Sequence shows daily charts of Tmin, Tmax, RR24 and snowdepth. All thumbnails link
to the Full-Resolution images.
To visualize the annual variation, these charts (except RR24 due to its random character) are shown
as thumbnail as of 15. of each month and as flip-book withthe image of the 5., 15. and 25. of each month.
 All MArine MET Reports of the Marine MET Office Hamburg of the last week are available here so that the forecast for extreme Storm
developments can be checked with what really happened.
All MArine MET Reports of the Marine MET Office Hamburg of the last week are available here so that the forecast for extreme Storm
developments can be checked with what really happened.
 TEMP Radiosonds


The TEMP Diagrams with evaluation have been drawn with the program
Metwatch.
Detailed explanations:
○ Diagrams
○ Vertical Profiles
~Teqpot
Of special interest are the TEMP Evaluations:
Wind with
the following parameters of the vertical wind profile:
✔ Wind DDD/FF, Temperature and Spread at Standard Pressure Levels.
✔ The vertical windshear is a measure of turbulence with a threshhold value
of 6 KT/1000ft for Risk of MOD TURB. Important for the development of turbulence is the Richardson number Ri which is
also computed by Metwatch. Ri describes the ratio of production of turbulence due to vertical windshear (VWS) and
its damping due to the stability of the vertical stratification. Turbulence becomes a hazard to aviation if Ri<1.
In the right diagram with the vertical windshear, marked by little vertical strokes with the strokes in red if Ri<1
indicating risk of turbulence.
✔ The horizontal temperature gradient, given in K/100nm, is a measure for
the intensity of a front.
✔ The temperature advection, given in K/6hrs, also indicates the intensity of a front.
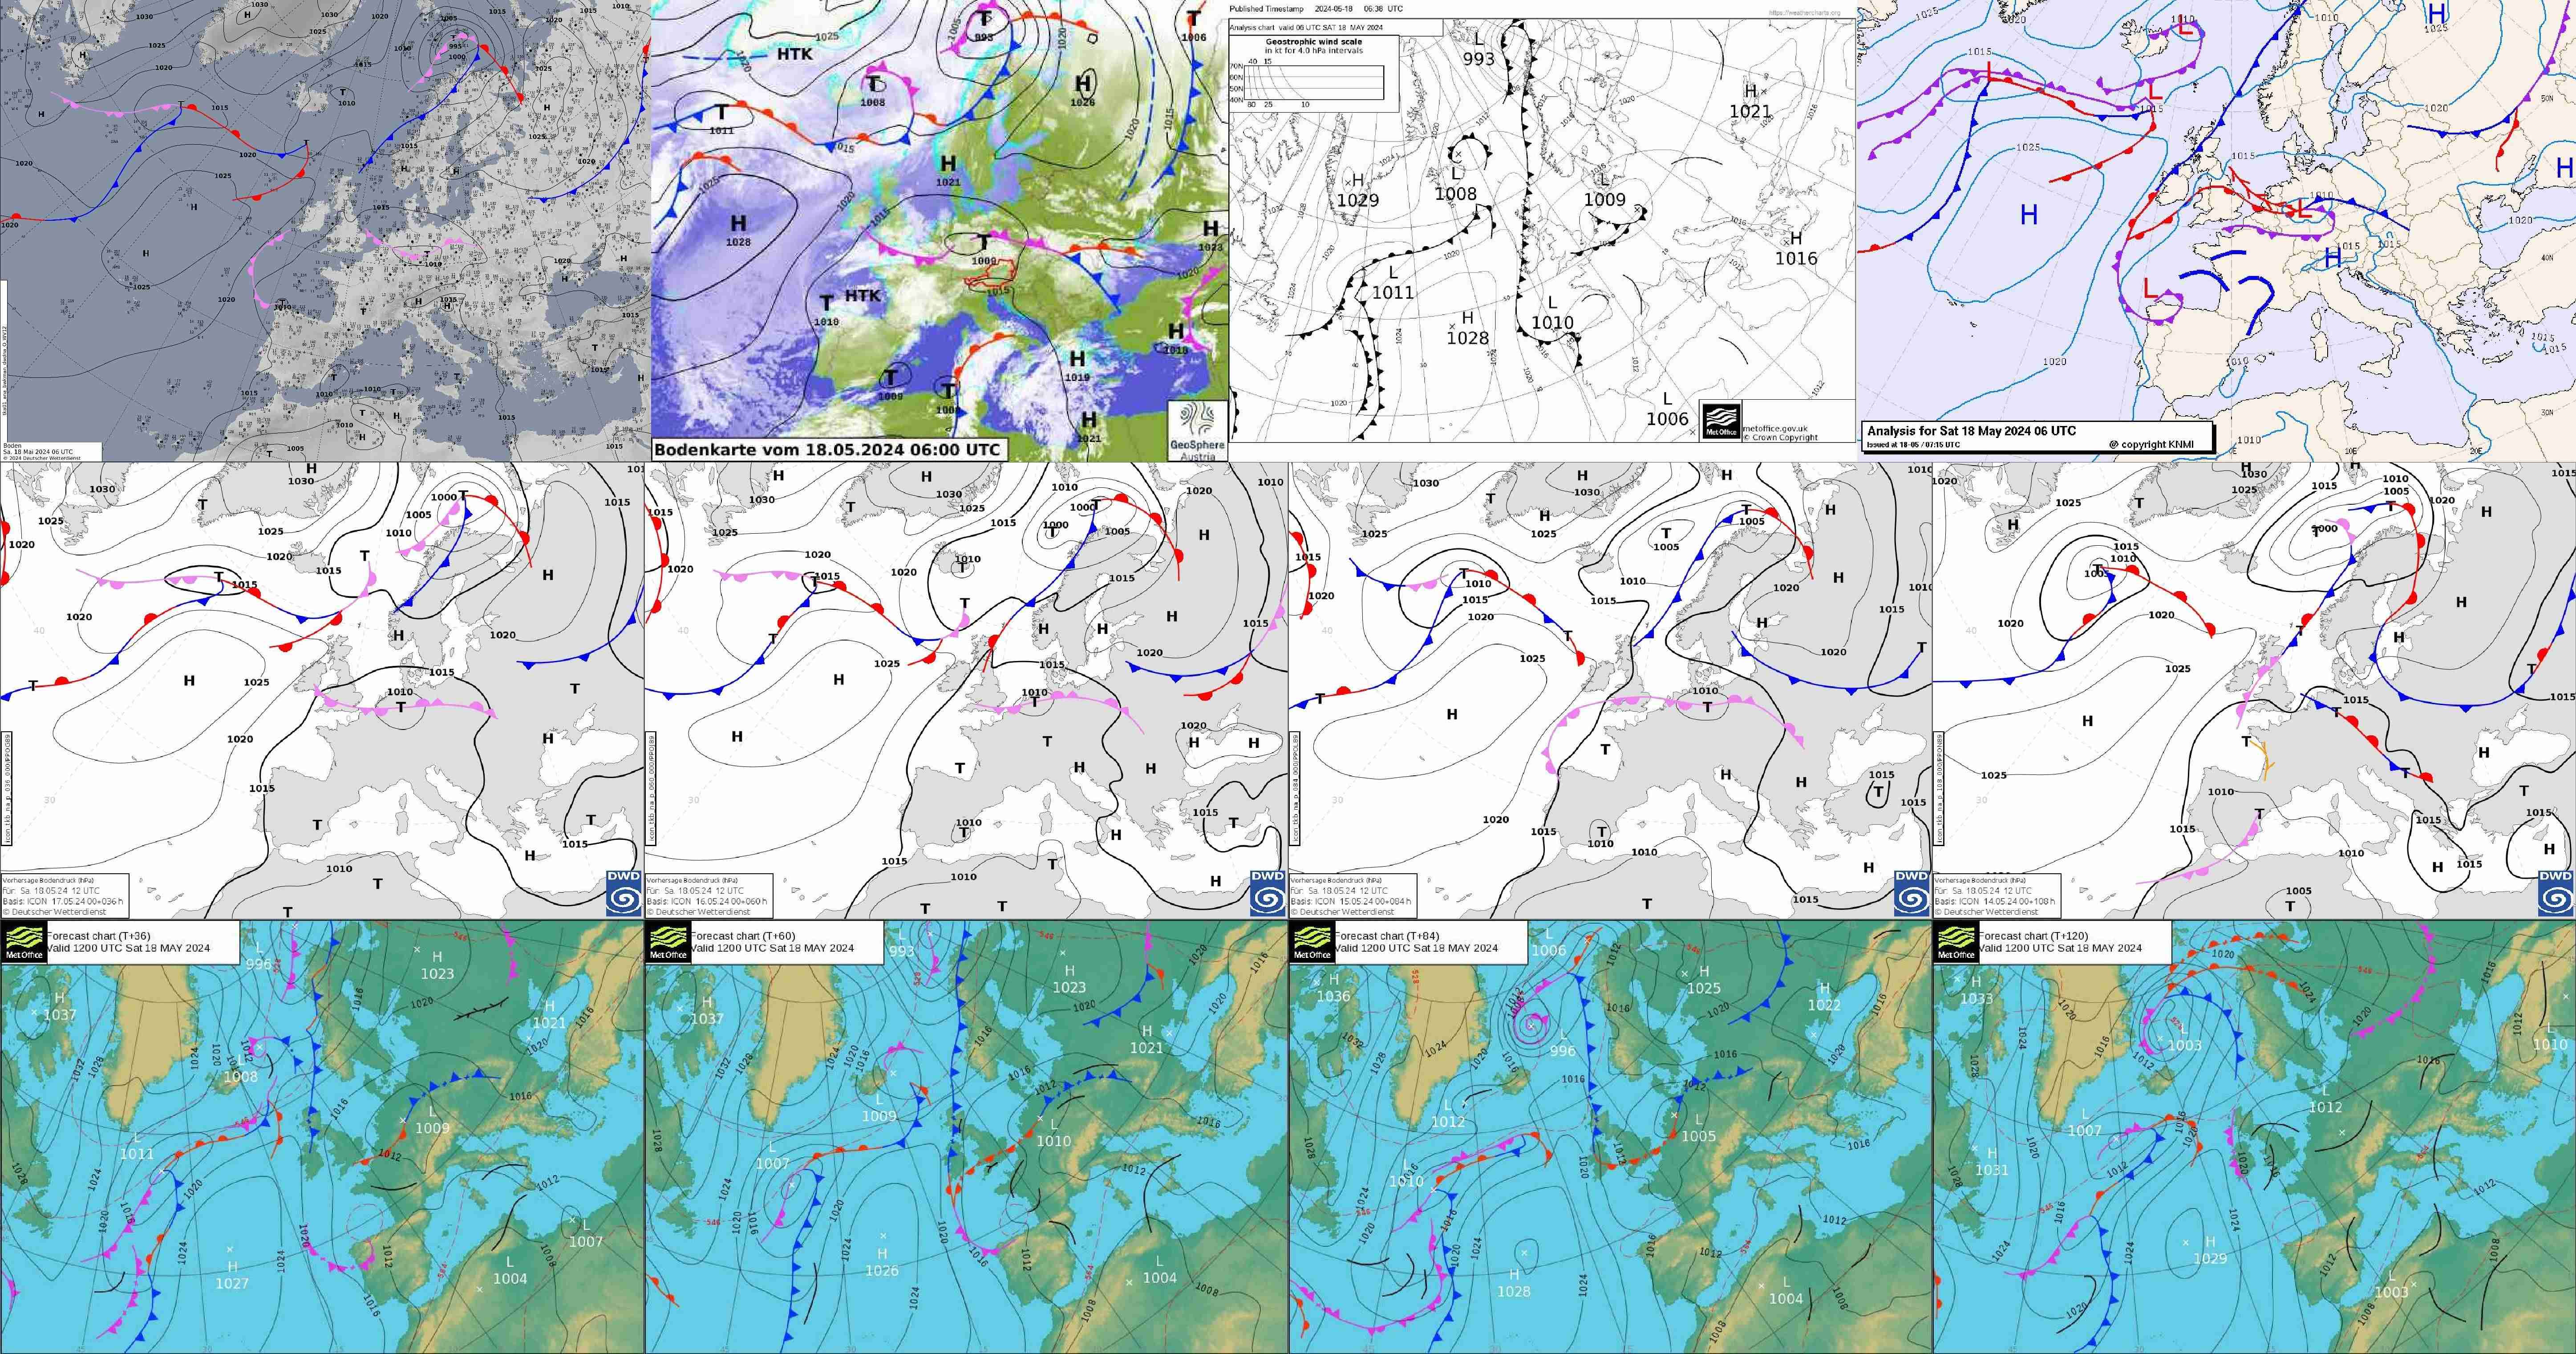
 Forecast Charts
✔ How was the forecast quality?
✔ How compare DWD vs UKM charts?
✔ How compare Forecast vs Analysis?
✔ Did the FCST give the right signal?
✔ Optimum:12 identical charts!
✔ All chart differences are FCST errors!
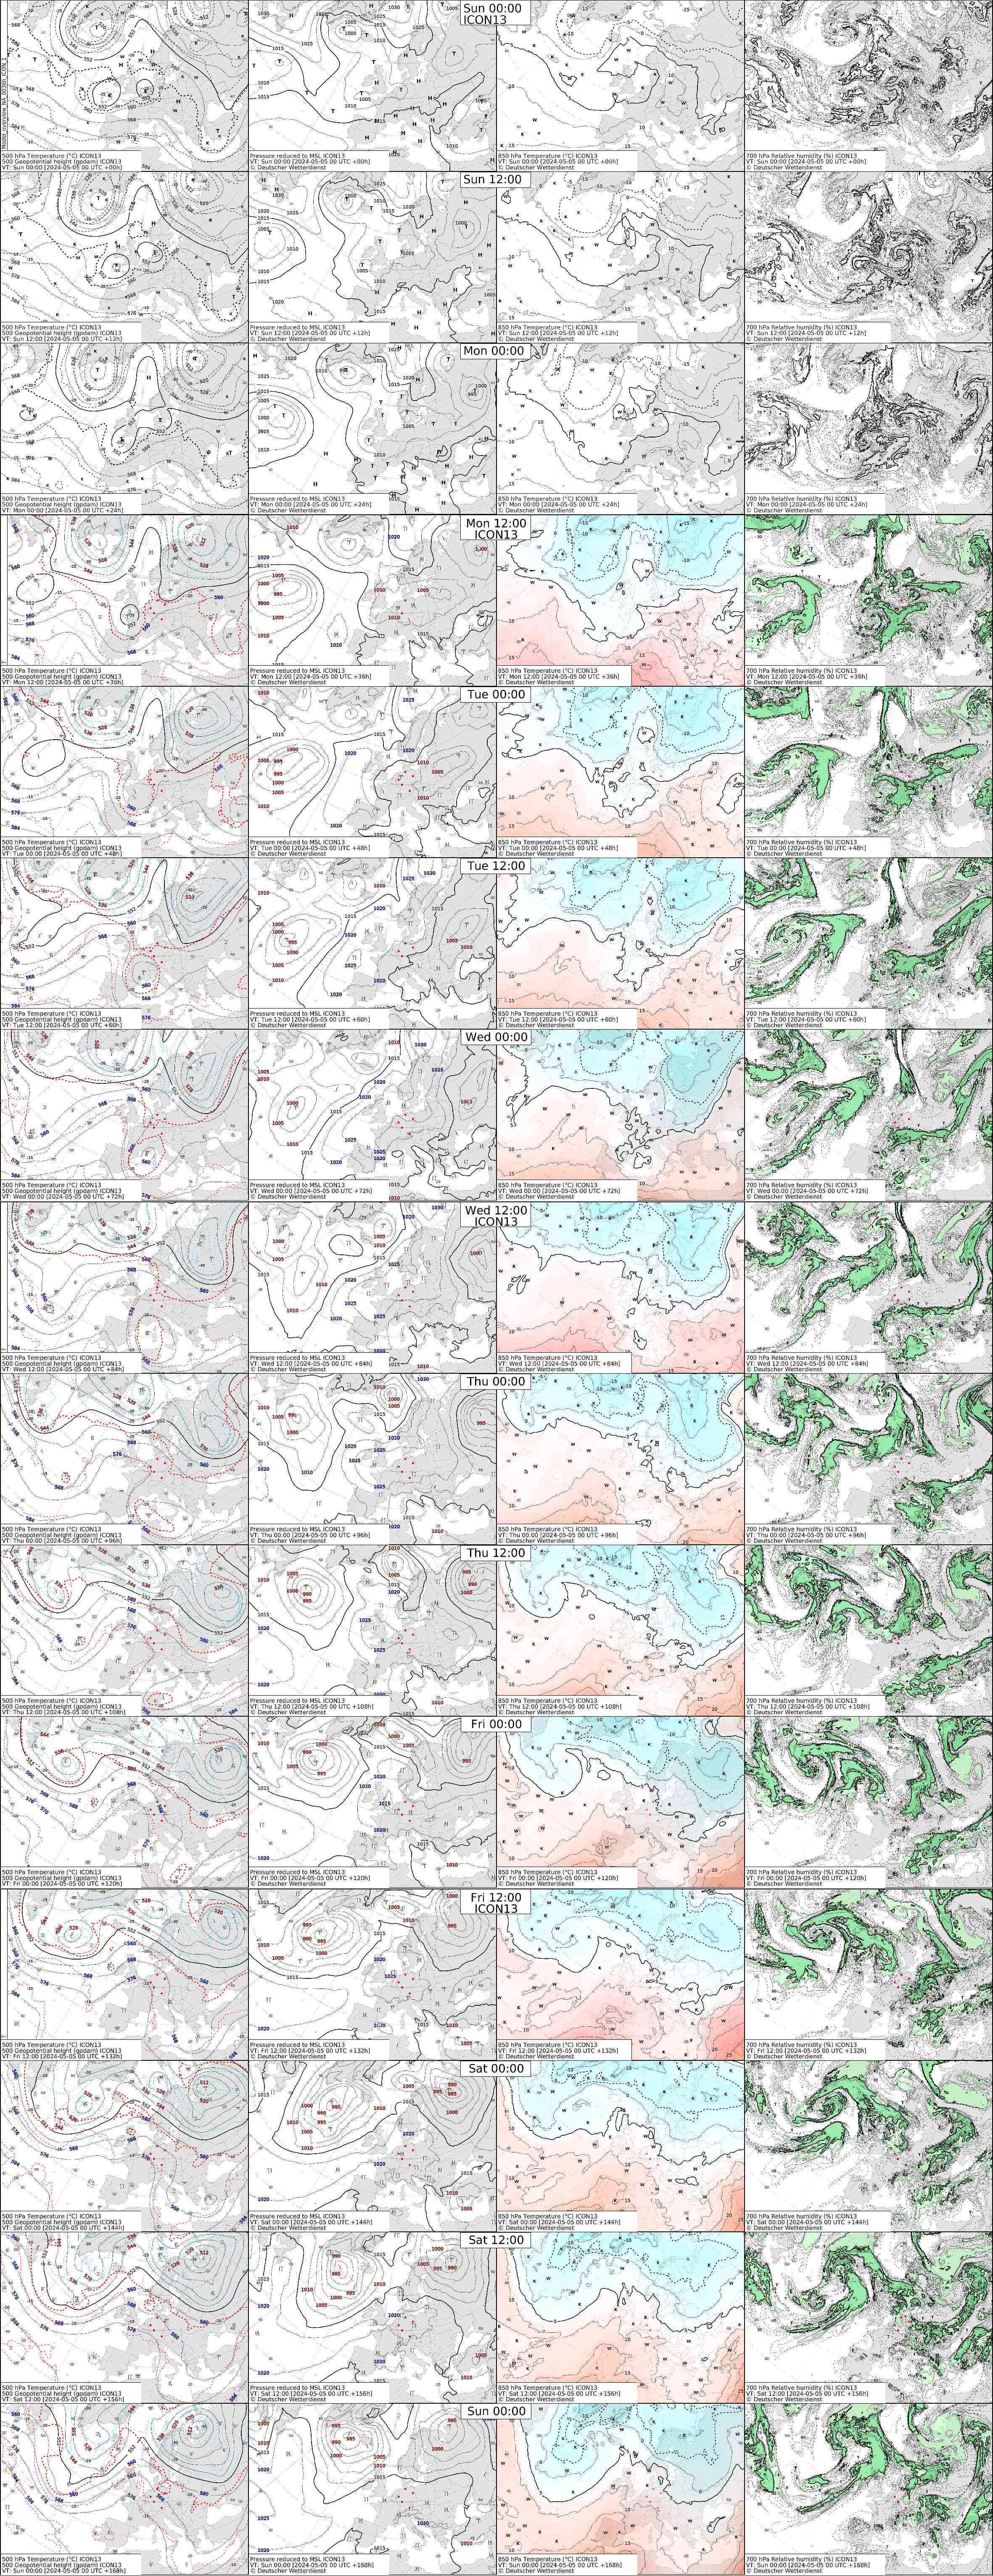
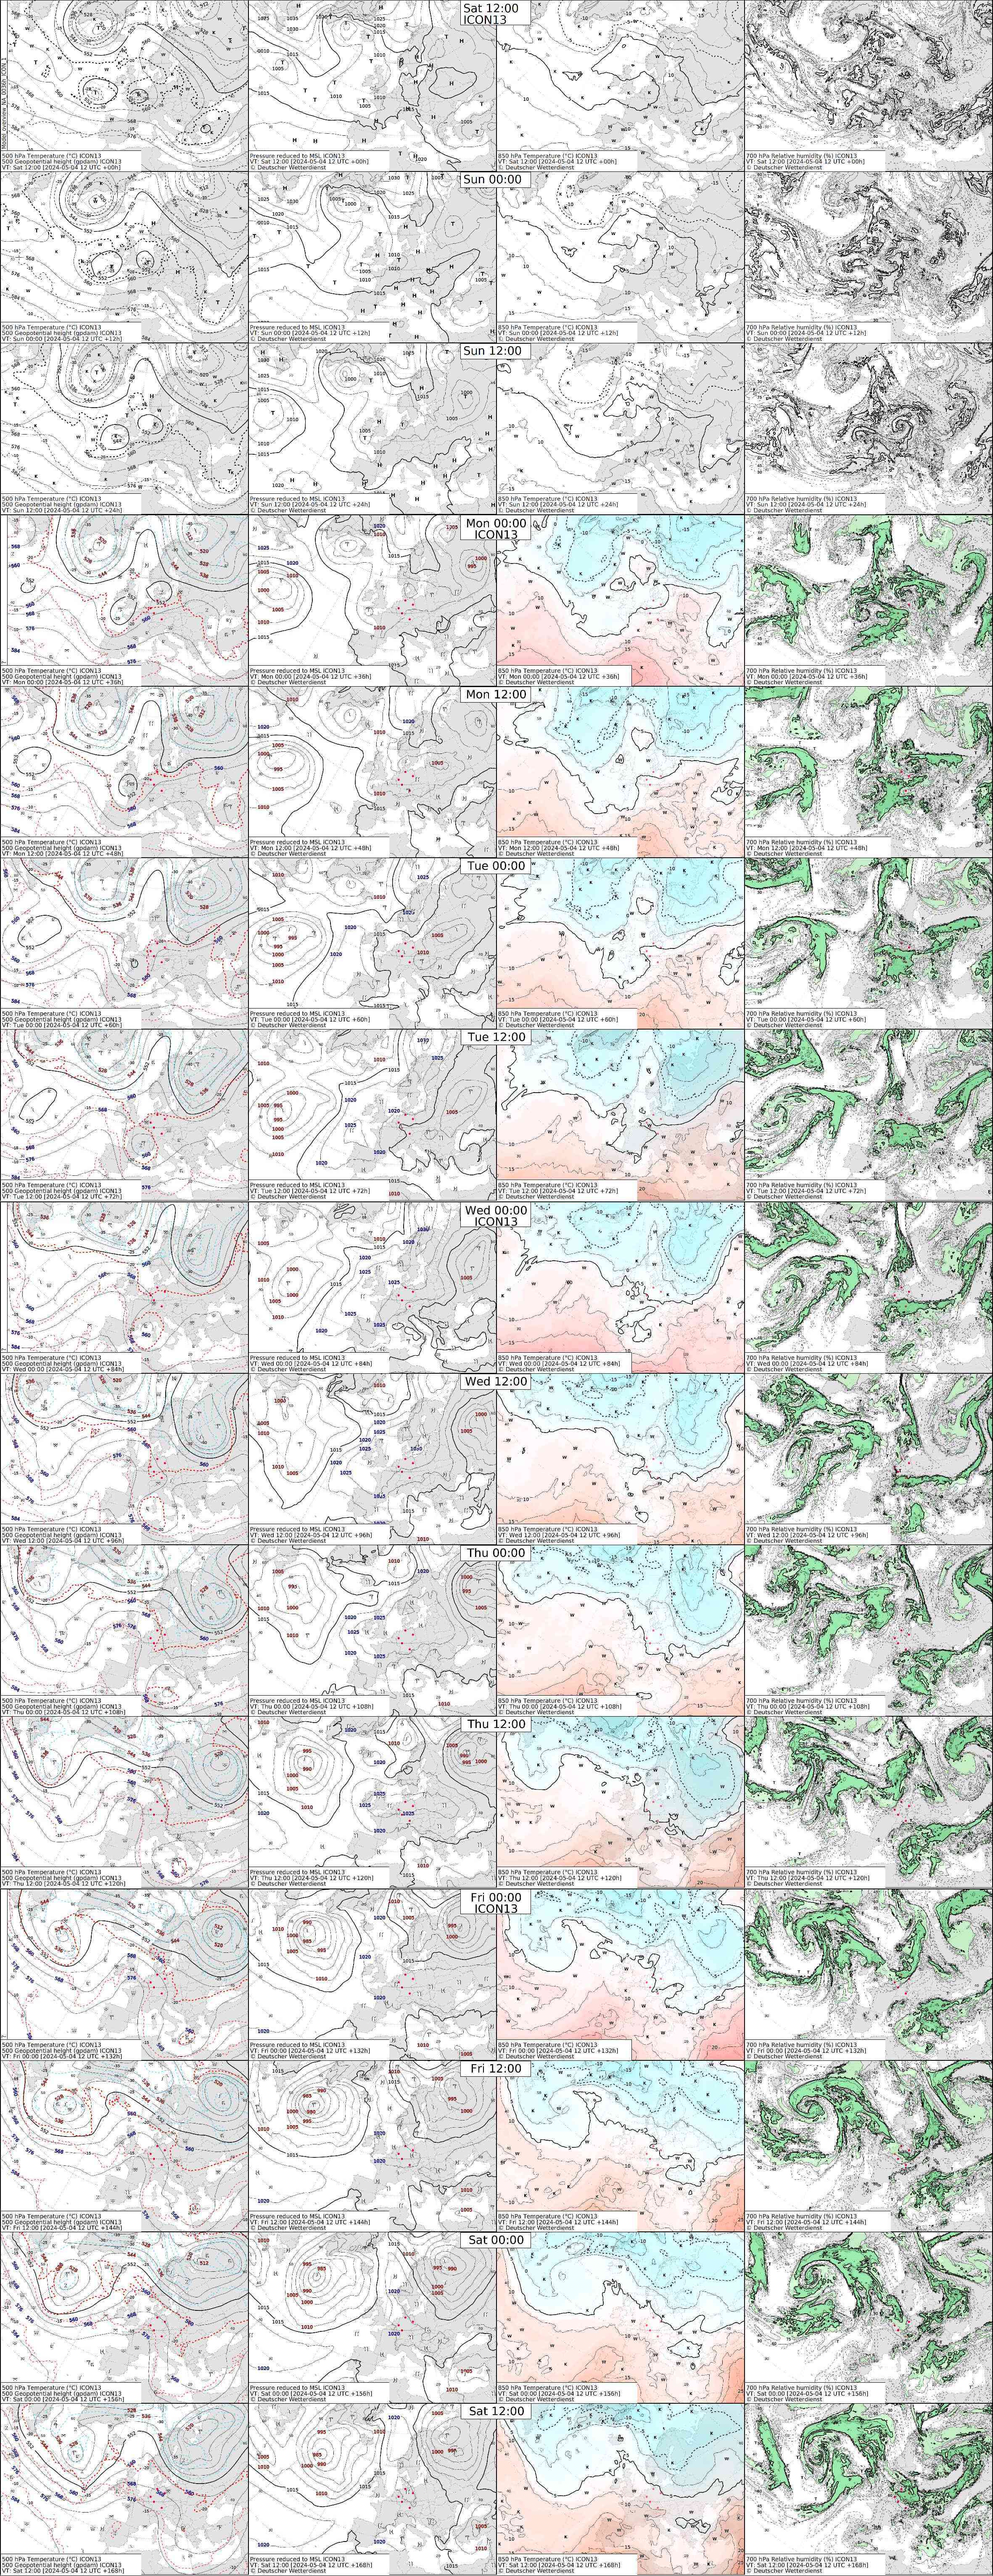
 FORECAST 'Old Style'
 00
DWD ICON
12
UTC
00
DWD ICON
12
UTC
00
ECMWF ENS Mean
12
UTC
✔ ICON Old Style shows ?
✔ ECMW Ensemble Mean shows ?
✔ DWD: 7 Tage
✔ ECMWF: 10 Tage
✔ DWD: MSLP T850 H500 rH700
✔ ECMWF: MSLP T850 H500
This is a very old fashioned visualization of DWD ICON und ECMWF IFS Models
as used in the 70s - this visualization is much adored by older colleagues
who see the moving pictures in their mind of experience rather than on the monitor.
Note
 Statistical Spot Forecasts
✔ How to improve then DMO (Direct Model Output) for Spot Forecasts?
✔ How to take into account local influence like Land-Sea-Breeze, Orography or similar?
✔ How to forecast Non-DMO-Prediktands?
Visibility Ceiling PROB_FF>50KT PROB_TS PROB_FZRA et al
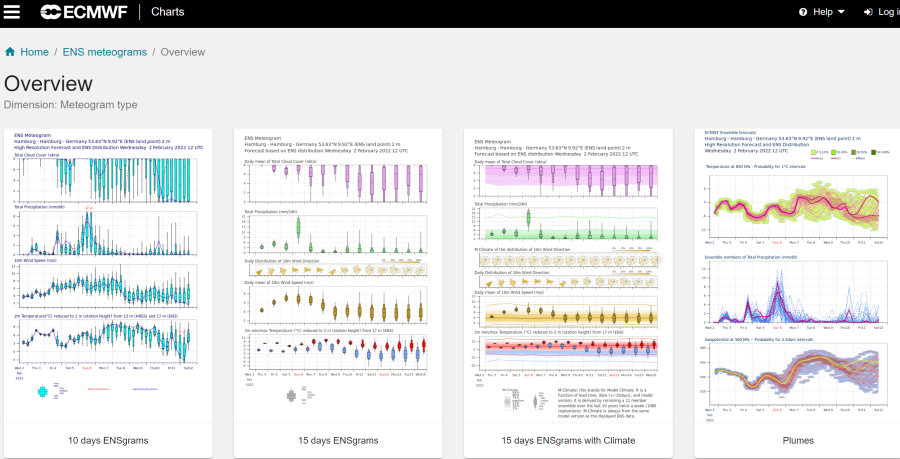
 Ensemble Forecast
Ensemble
Technology
Technologie
✔ How is the Ensemble Forecast of Temperature, Preciupitation and Wind?
✔ What does the
Box(-and-Whisker)-Plot tell us?
✔ How to express the stochastic character of Weather?
✔ How do the Ensemble-Forecast predict Medium-Range?
✔ How do the 'Plumes' of Temperature T850 develop?
✔ How is the statistical distribution of the wind?
 WEBCAMS
✔ Appearance of the cloudy sky ?
✔ Cross-check Analysis / Forecast
✔ Web-/Livecams-Links are ...
 Direct Links to the URLs
Direct Links as 'flip-book'
Direct Links to Livecams
 Links to processed Quads
 TROPICAL STORM CHECK
✔ Where are Tropical Storms?
✔ How are the estimated tracks?
✔ How is the Forecast of
National Hurricane Center and
Uni Wisconsin?
 Satellites
DWD Satellite Viewer
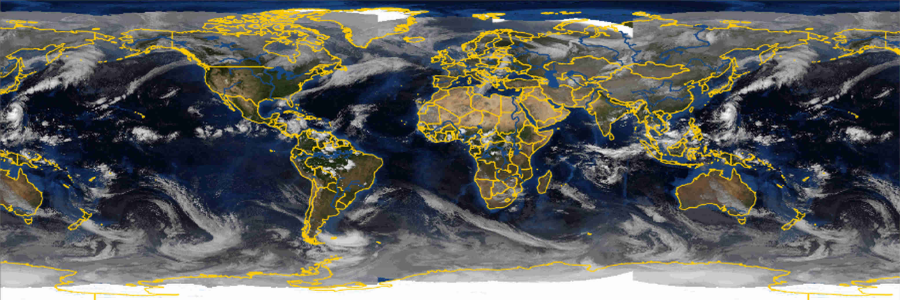
Find more regional SAT images below the DWD-Sat-Viewer.
Actual SAT images in chapter Analysis
VIS/IR Cloud Type/Top-Temperat


◀VISIR▶
◀CTYPE▶
◀CTOPT▶
✔ VIS/IR VIS images in the daytime and IR images during night show a similar appearance.
✔ Cloud Type images with multi-frequency sensors to enhance vatious cloud types.
✔ Cloud Top Temperatures show IR images with a temperature colour-scale for cloud top-temperature identification.
✔ The buttons below the SAT images show the last four pictures of the past hour.
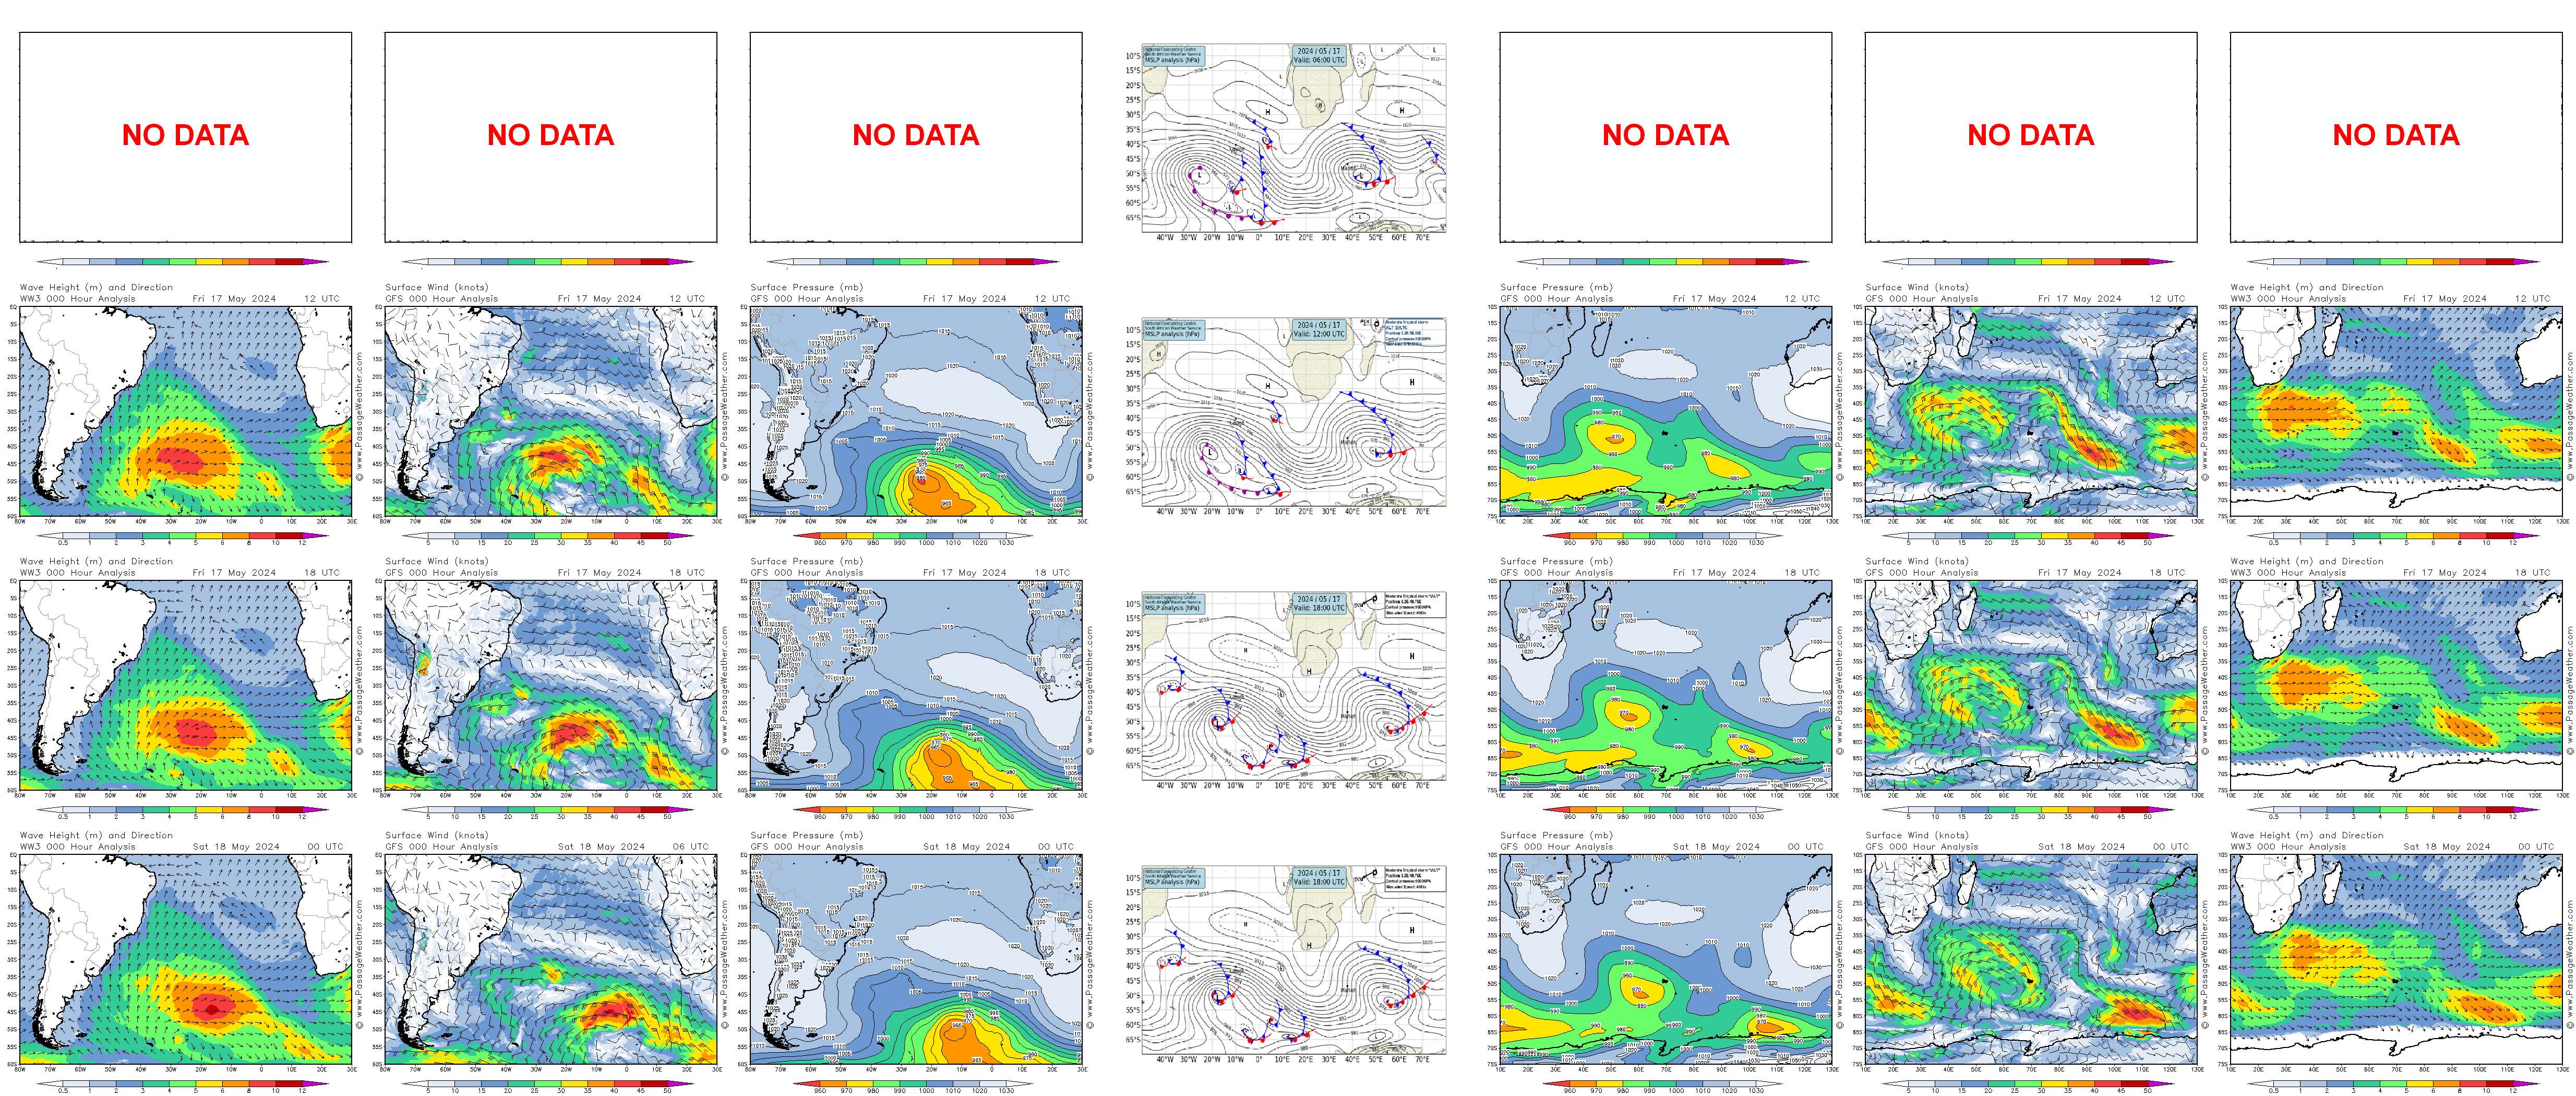
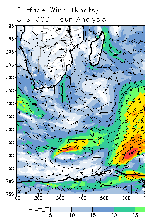
 GRIB FORECAST SEEGEBIETE WELTWEIT, FORECAST UND HINDCAST
Click left side of Graph
HINDCAST
Click right side of Graph
FORECAST
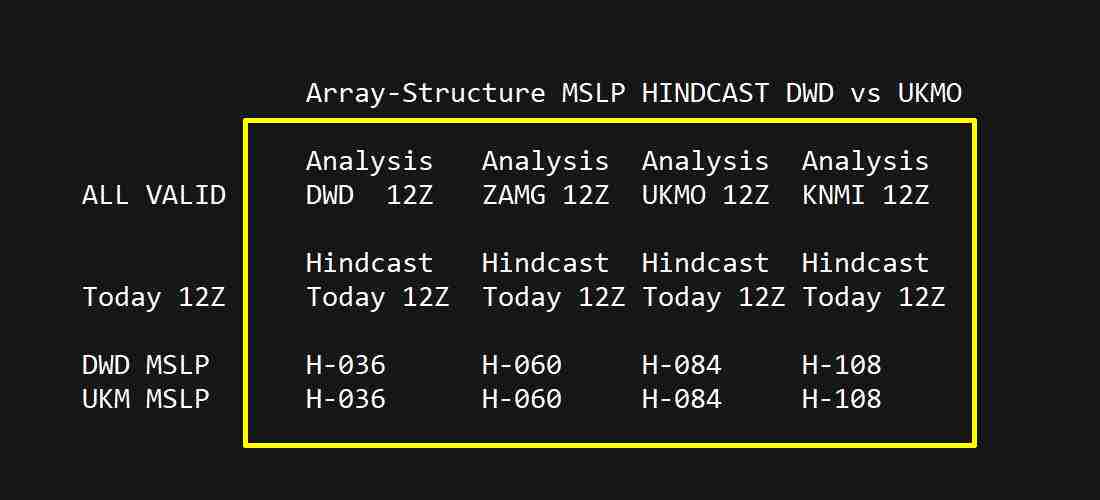
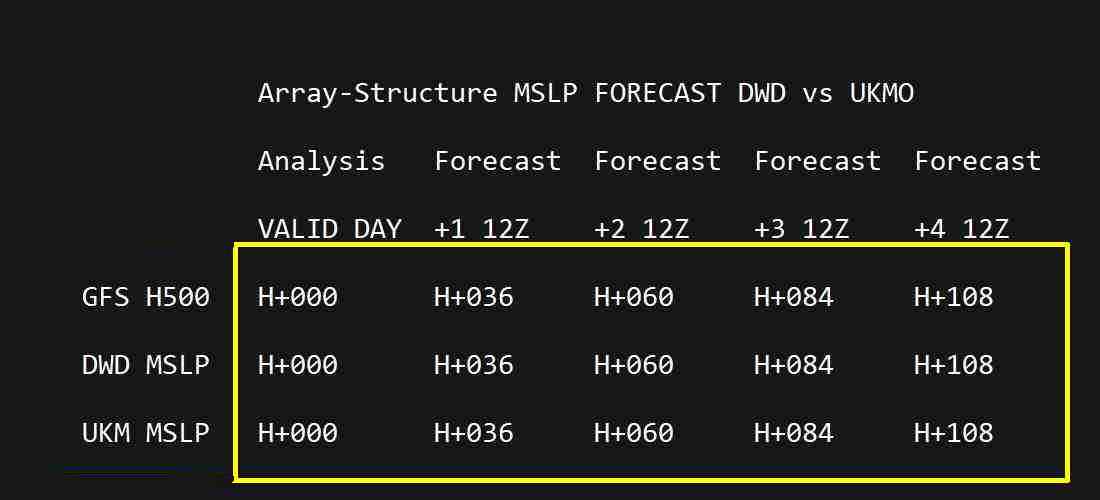
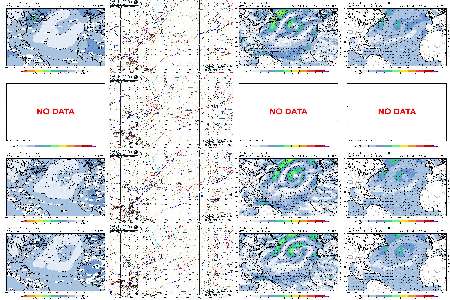
By clicking the left side of a graph you see the HINDCAST, clicking the right side of a graph shows the FORECAST.
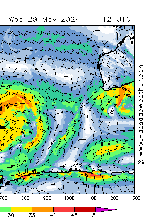
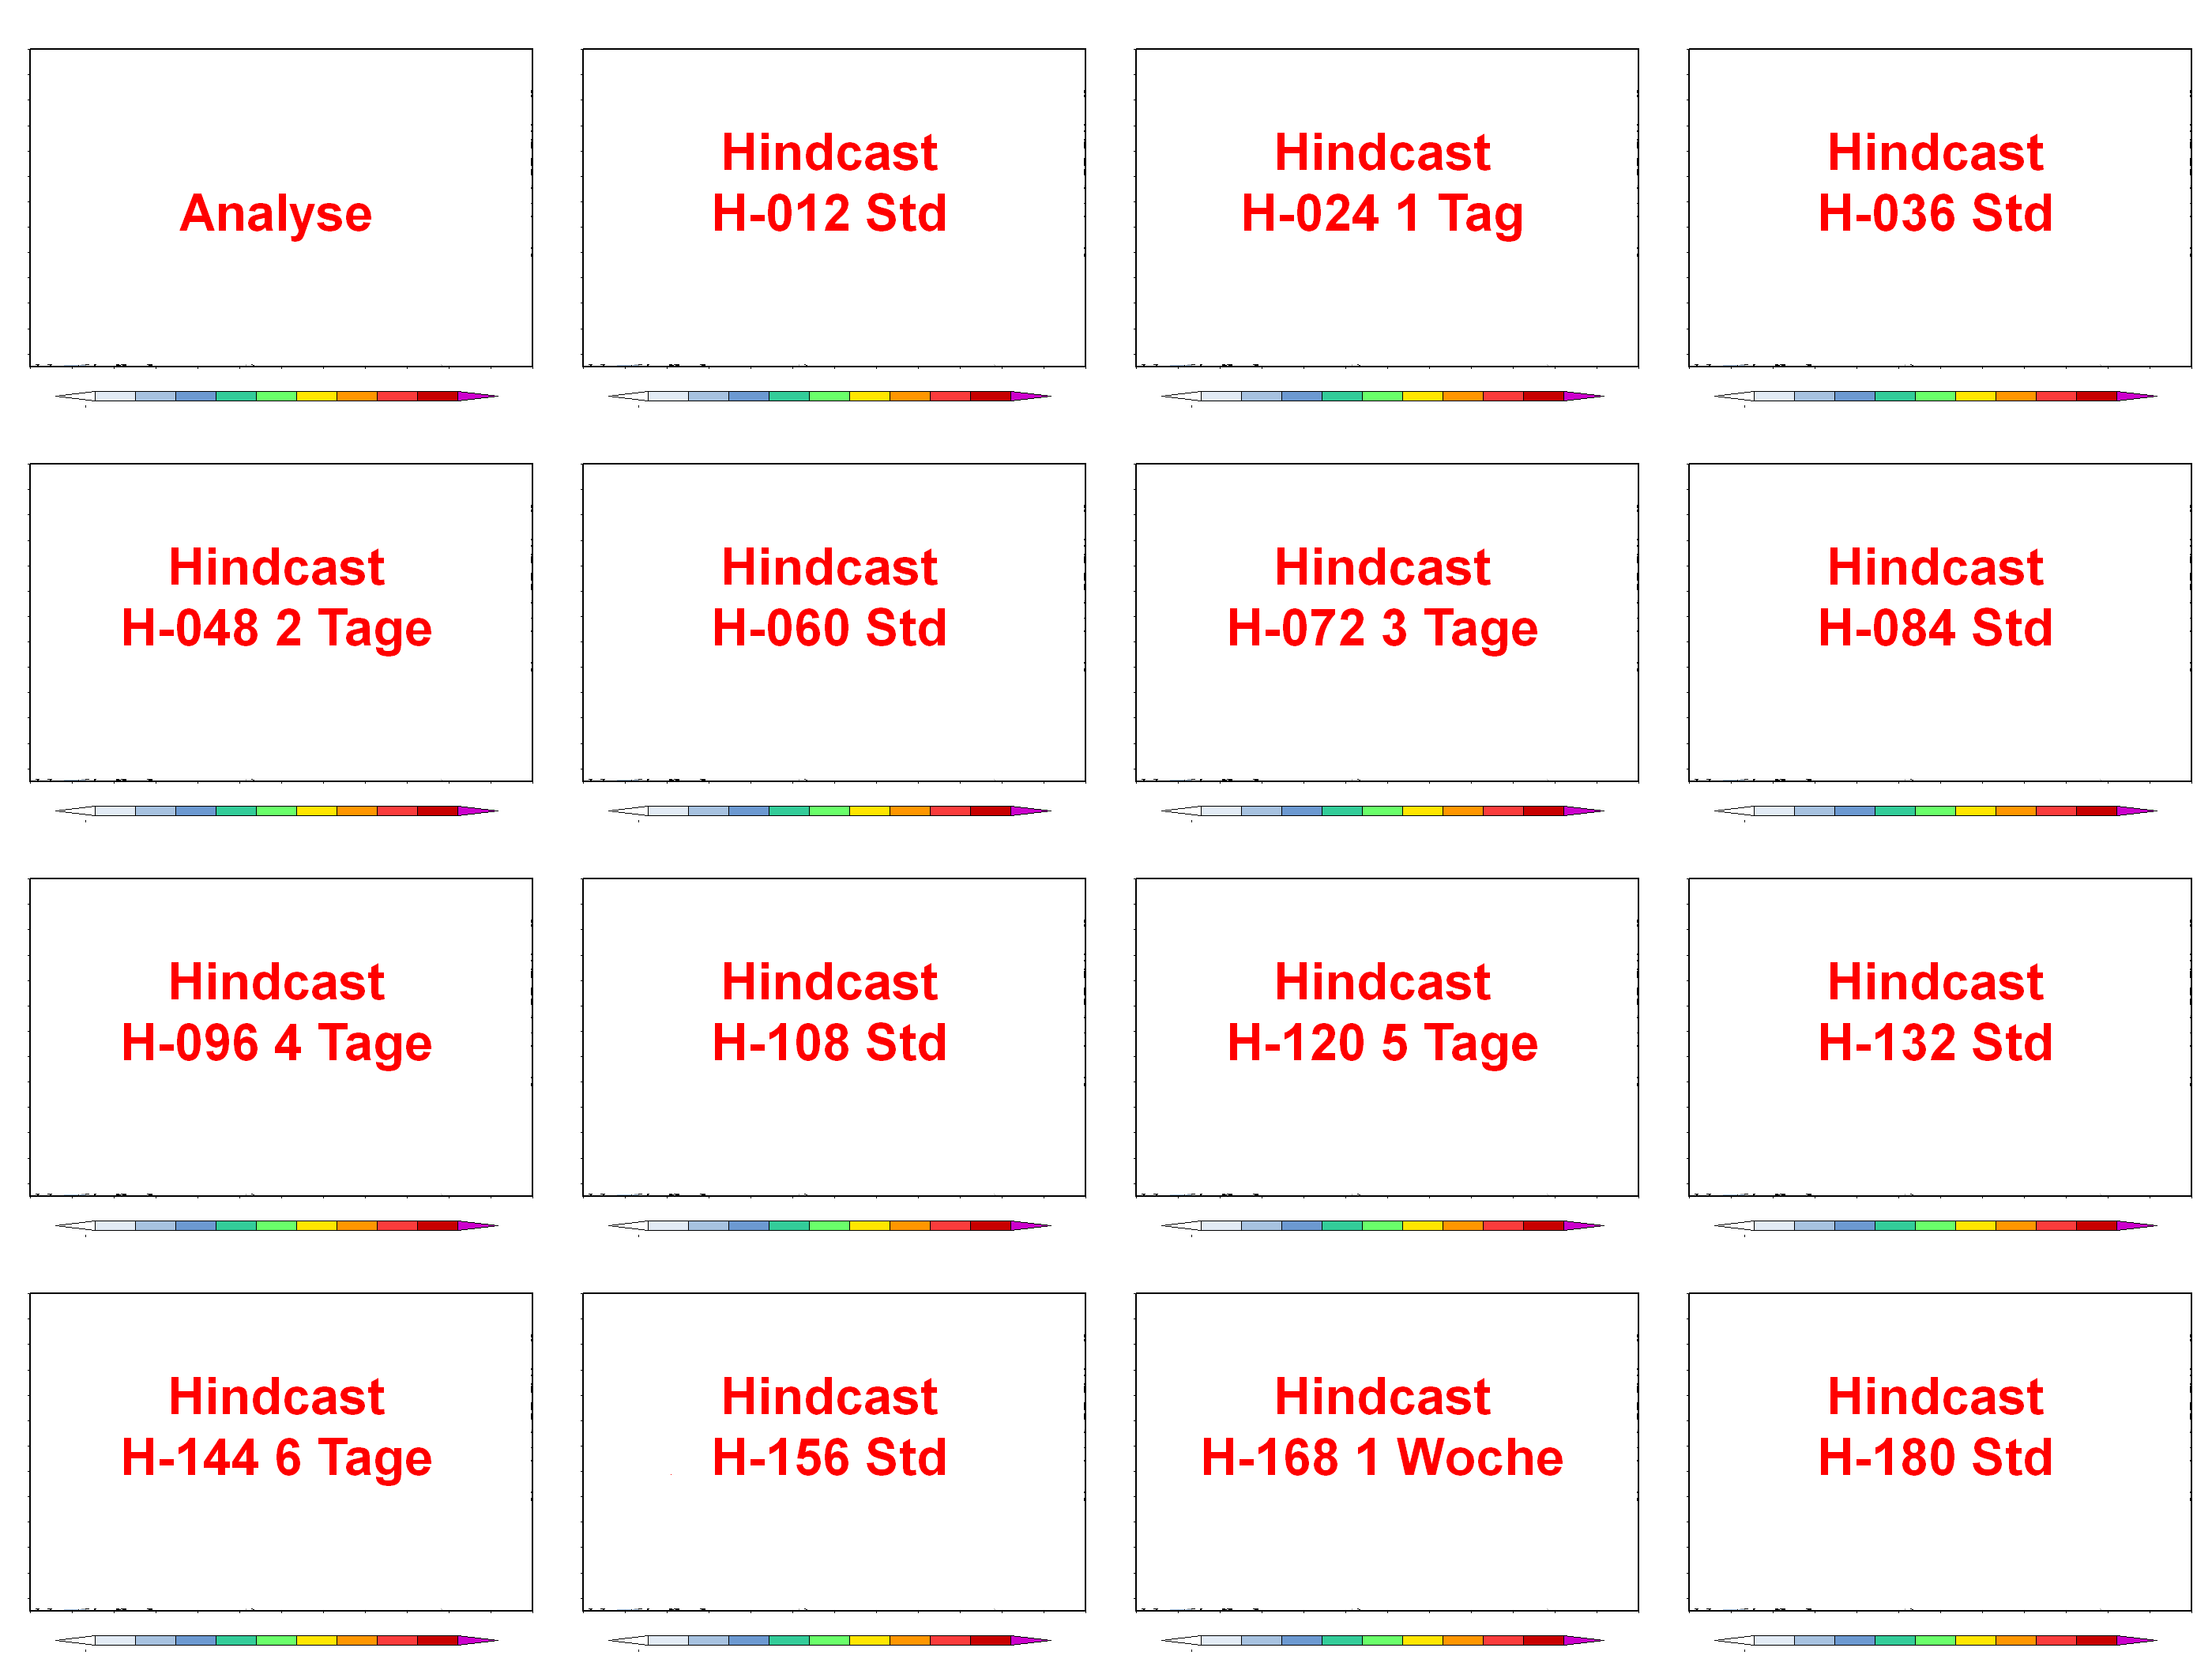
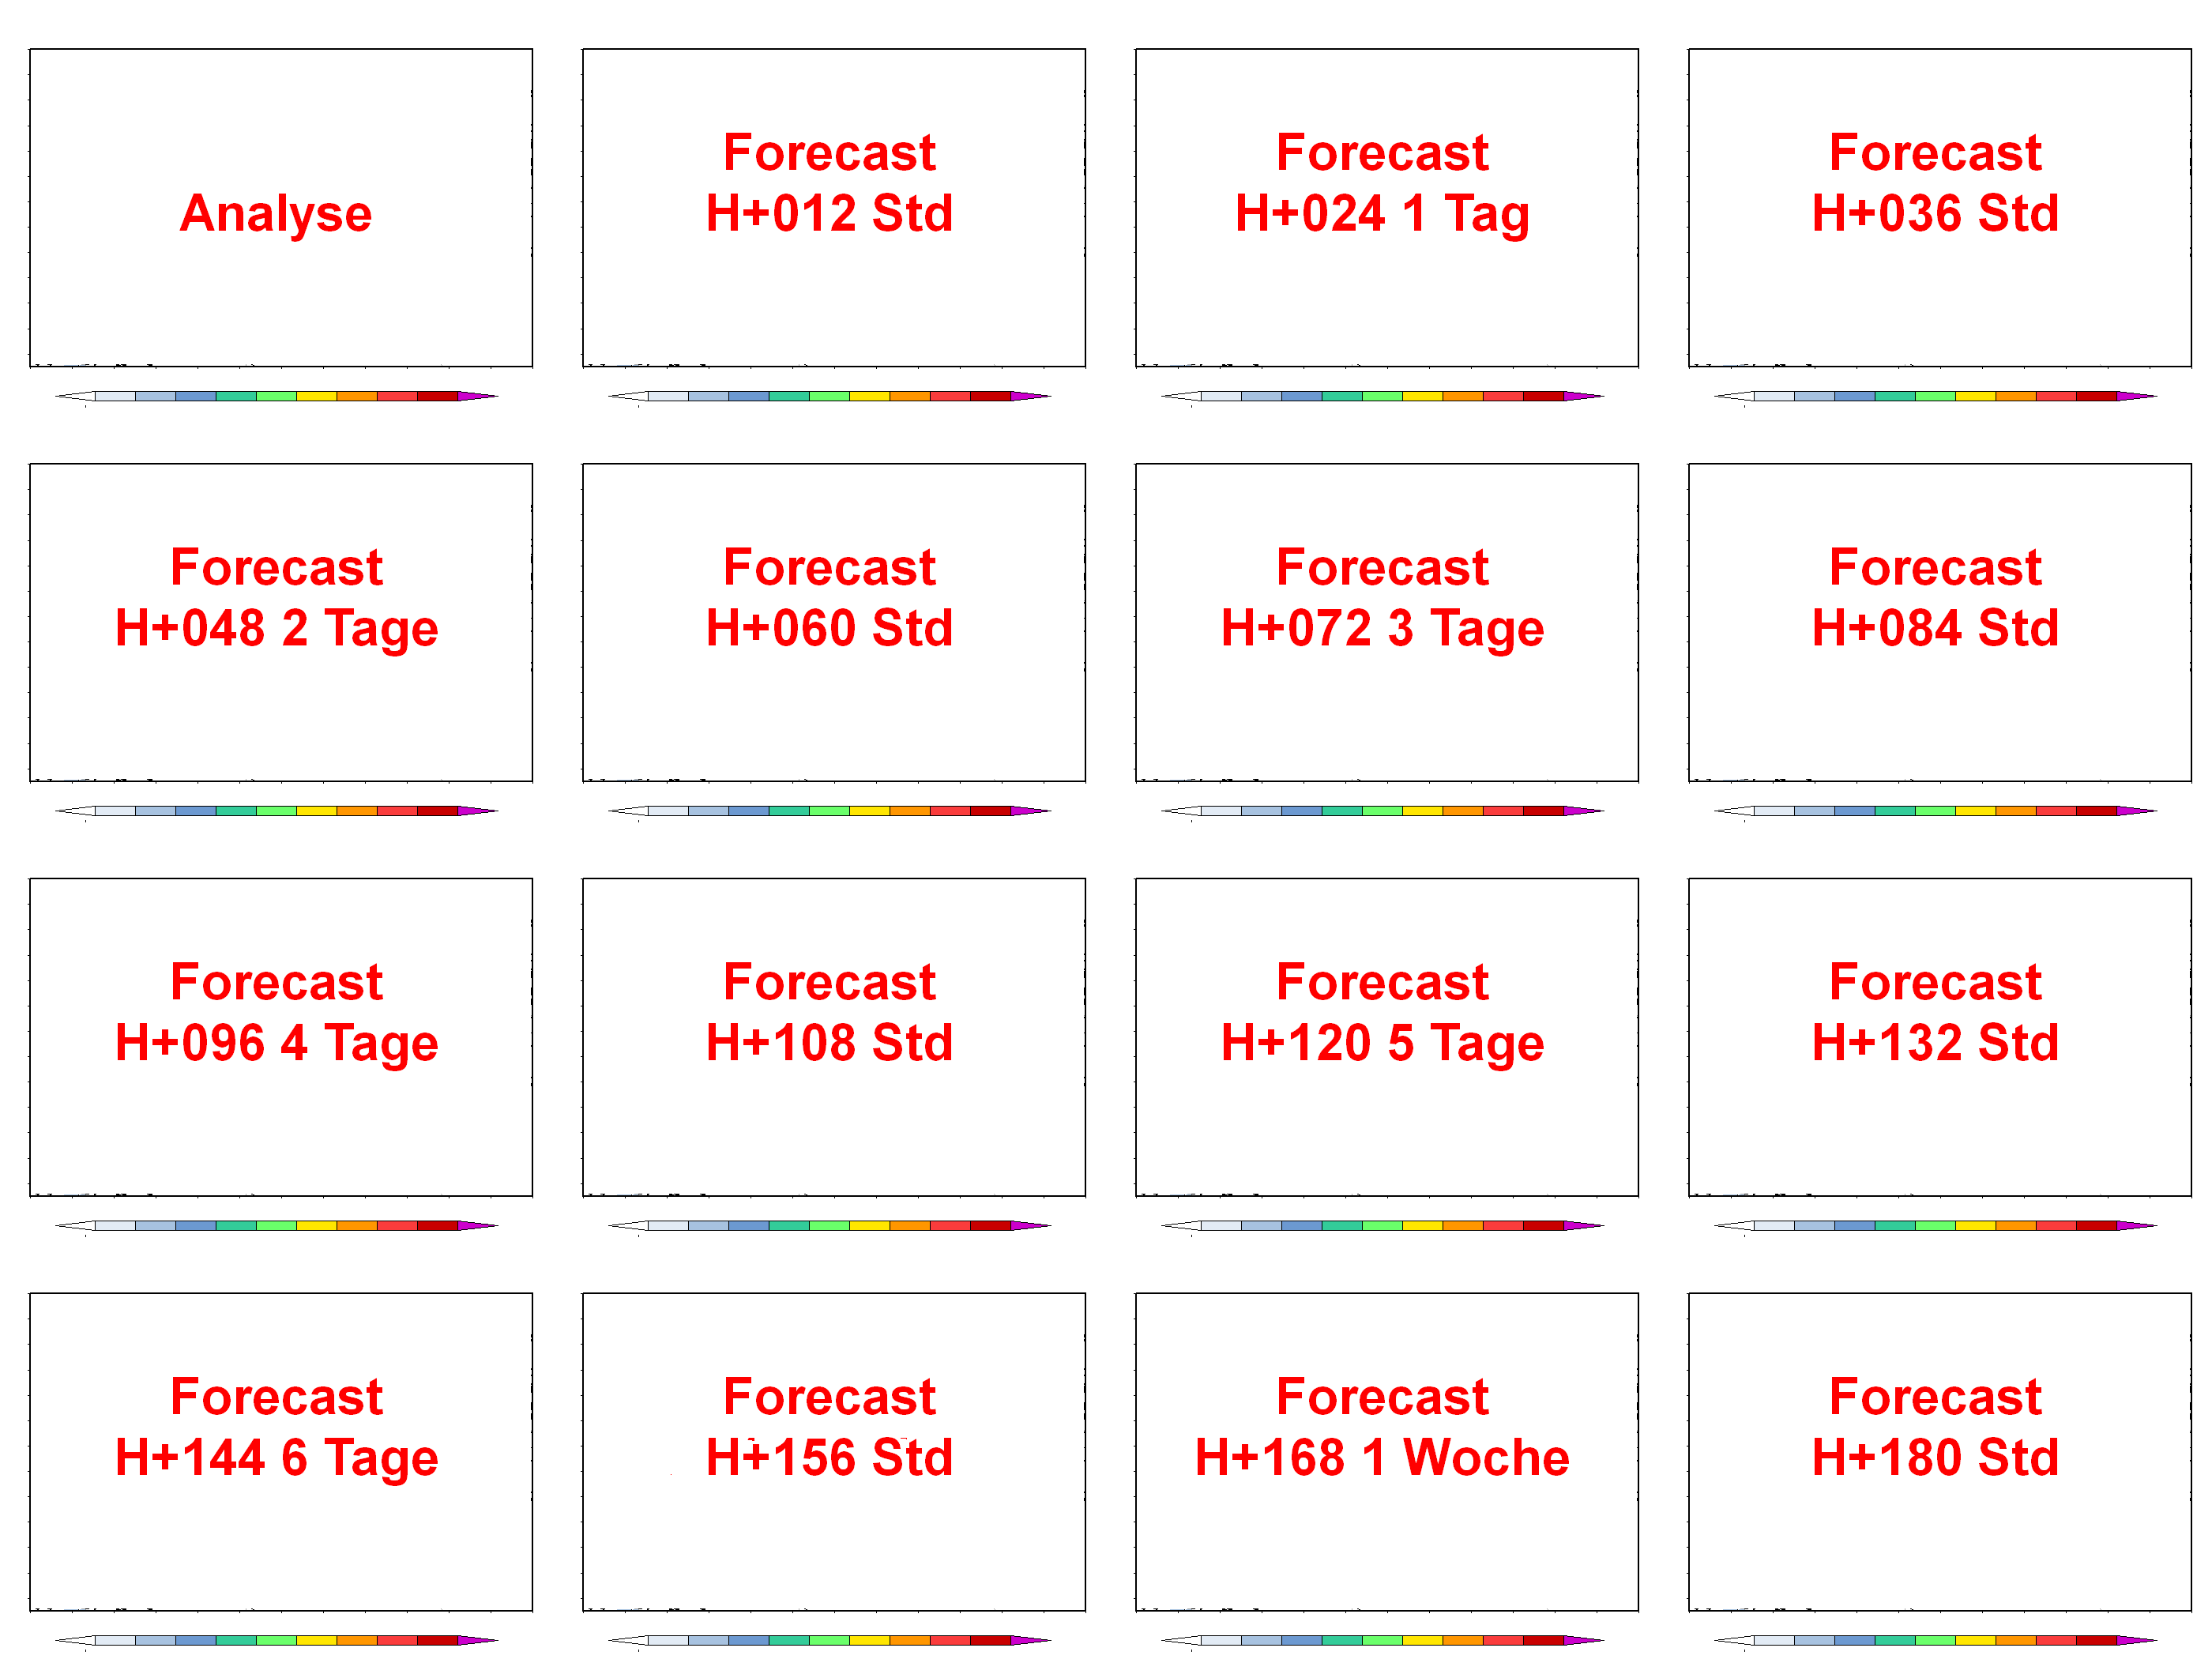
Left Images: Array Structure Hindcast/Forecast
Right Images: Thumbnail to Hindcast/Forecast Arrays
Click left side of Graph
Click right side of Graph
Δt=3h
Brit.Inseln
Nordsee
Ostsee
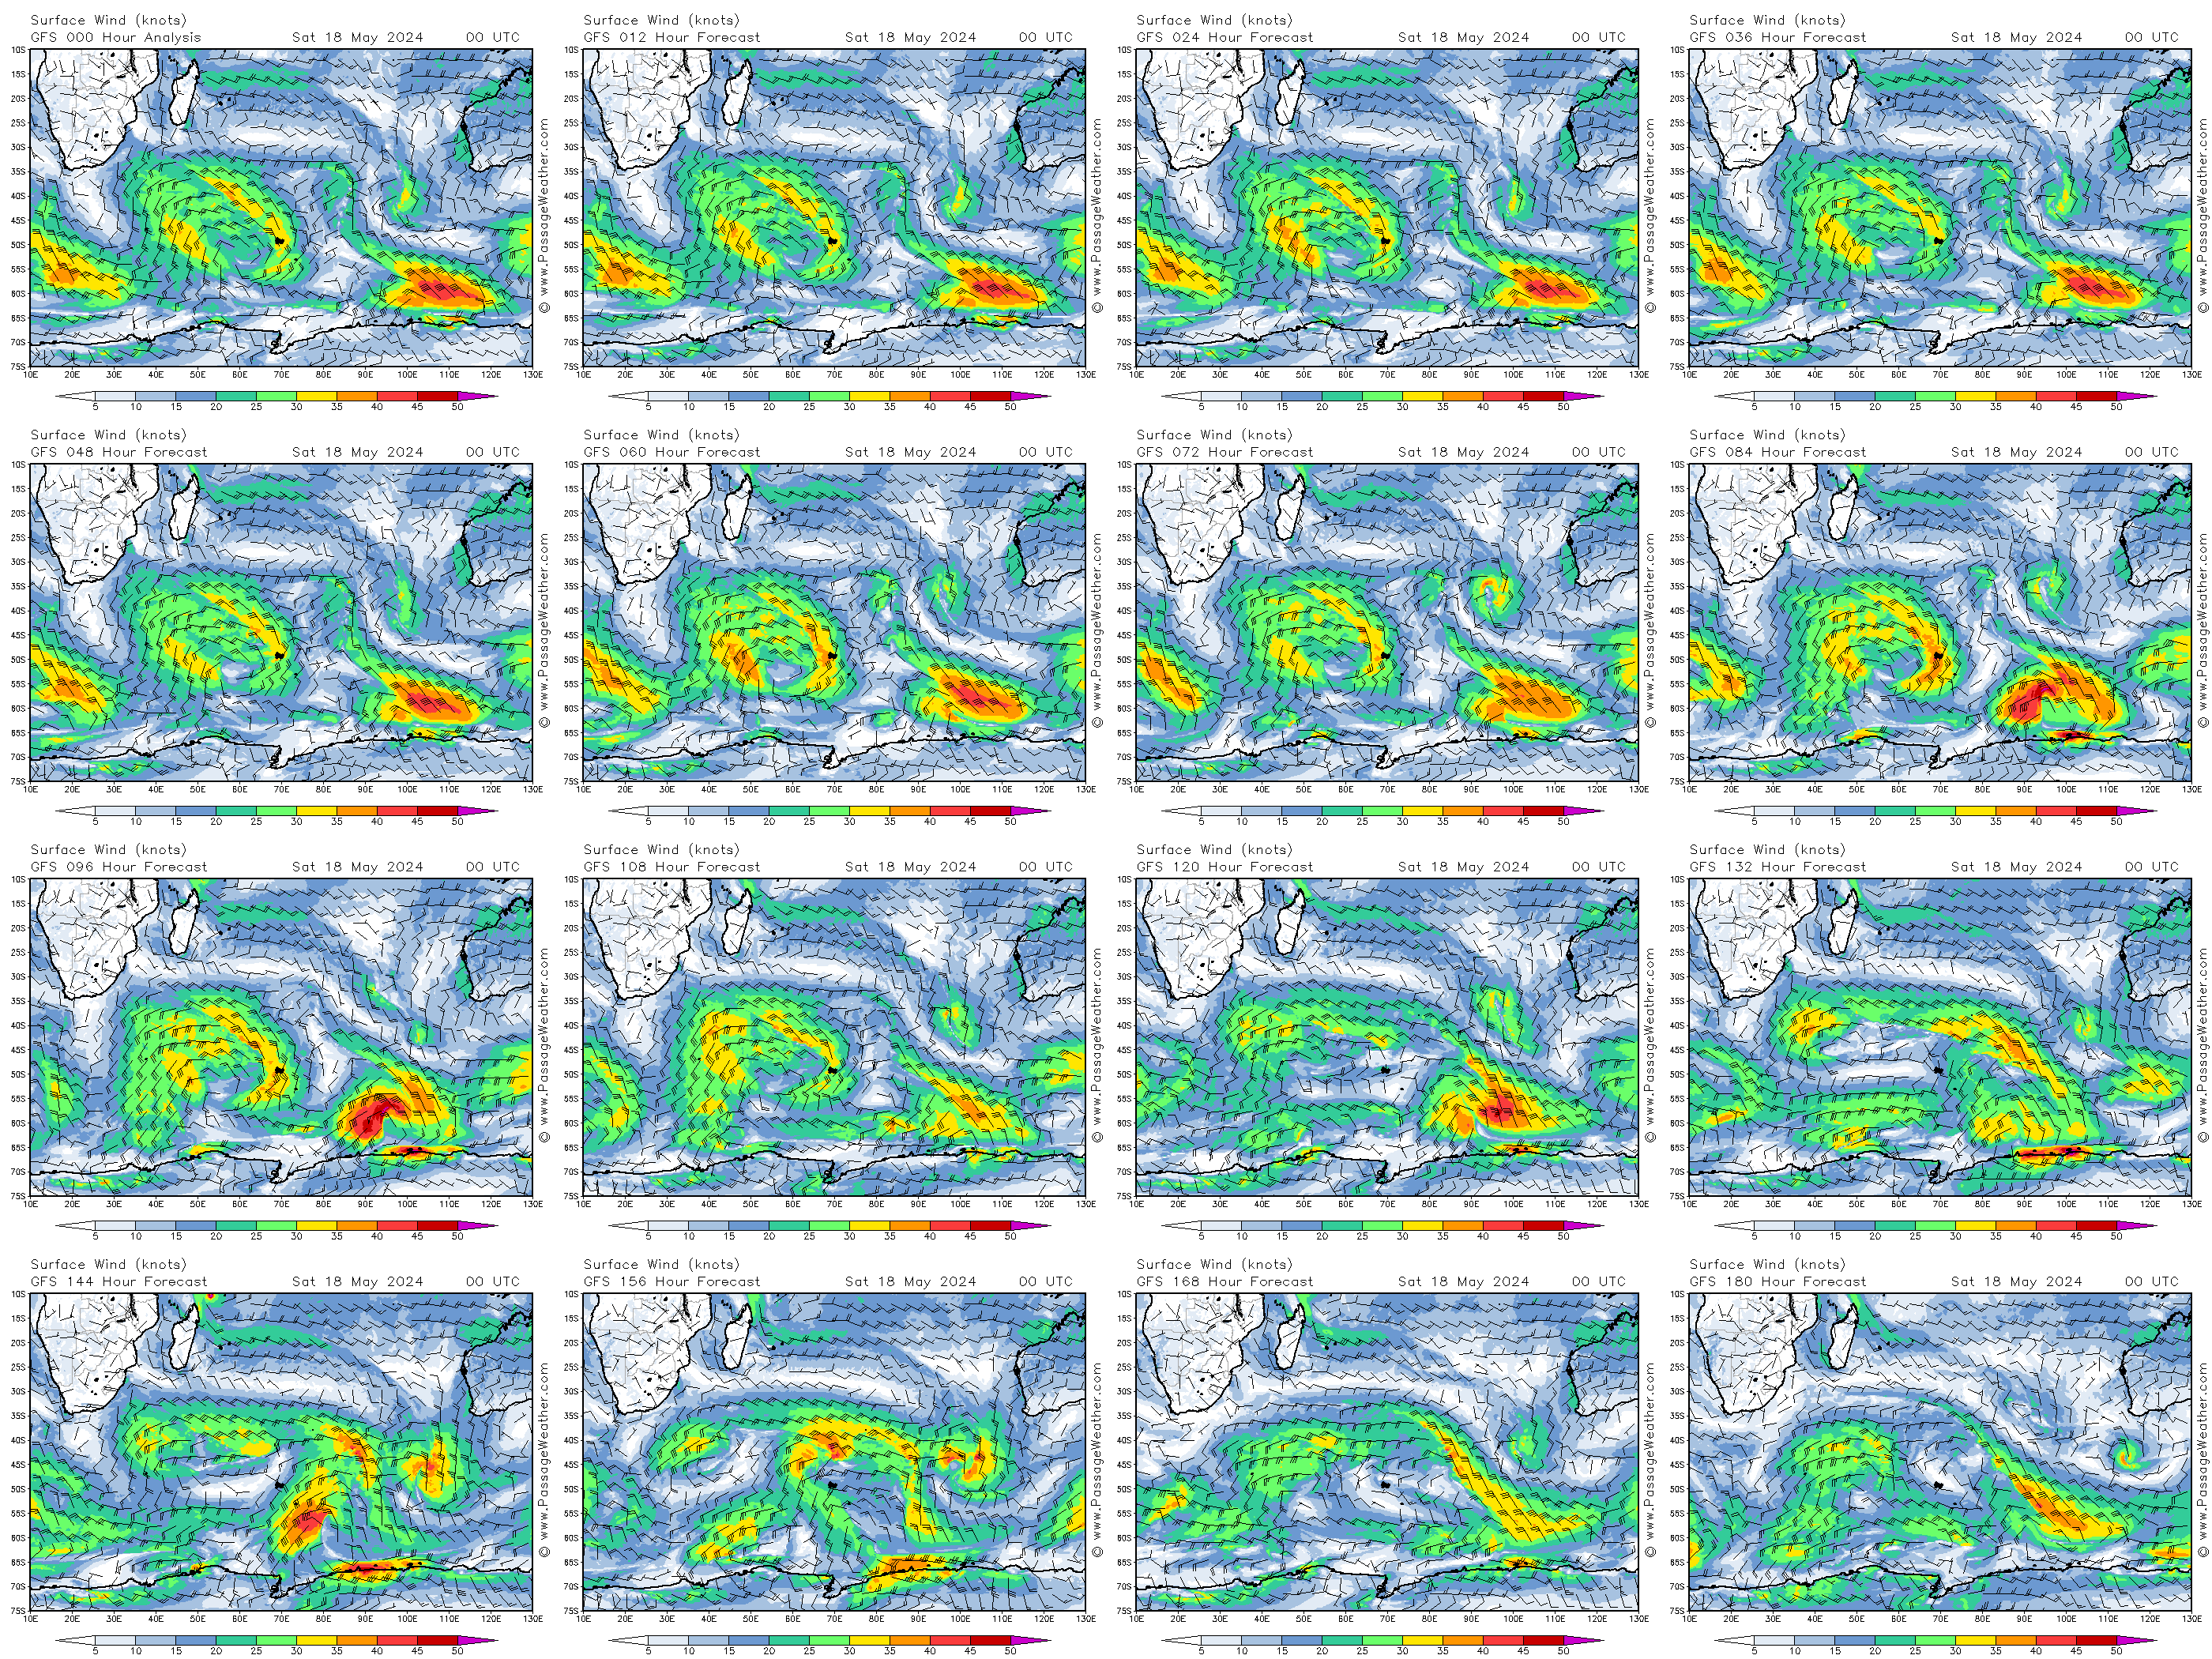
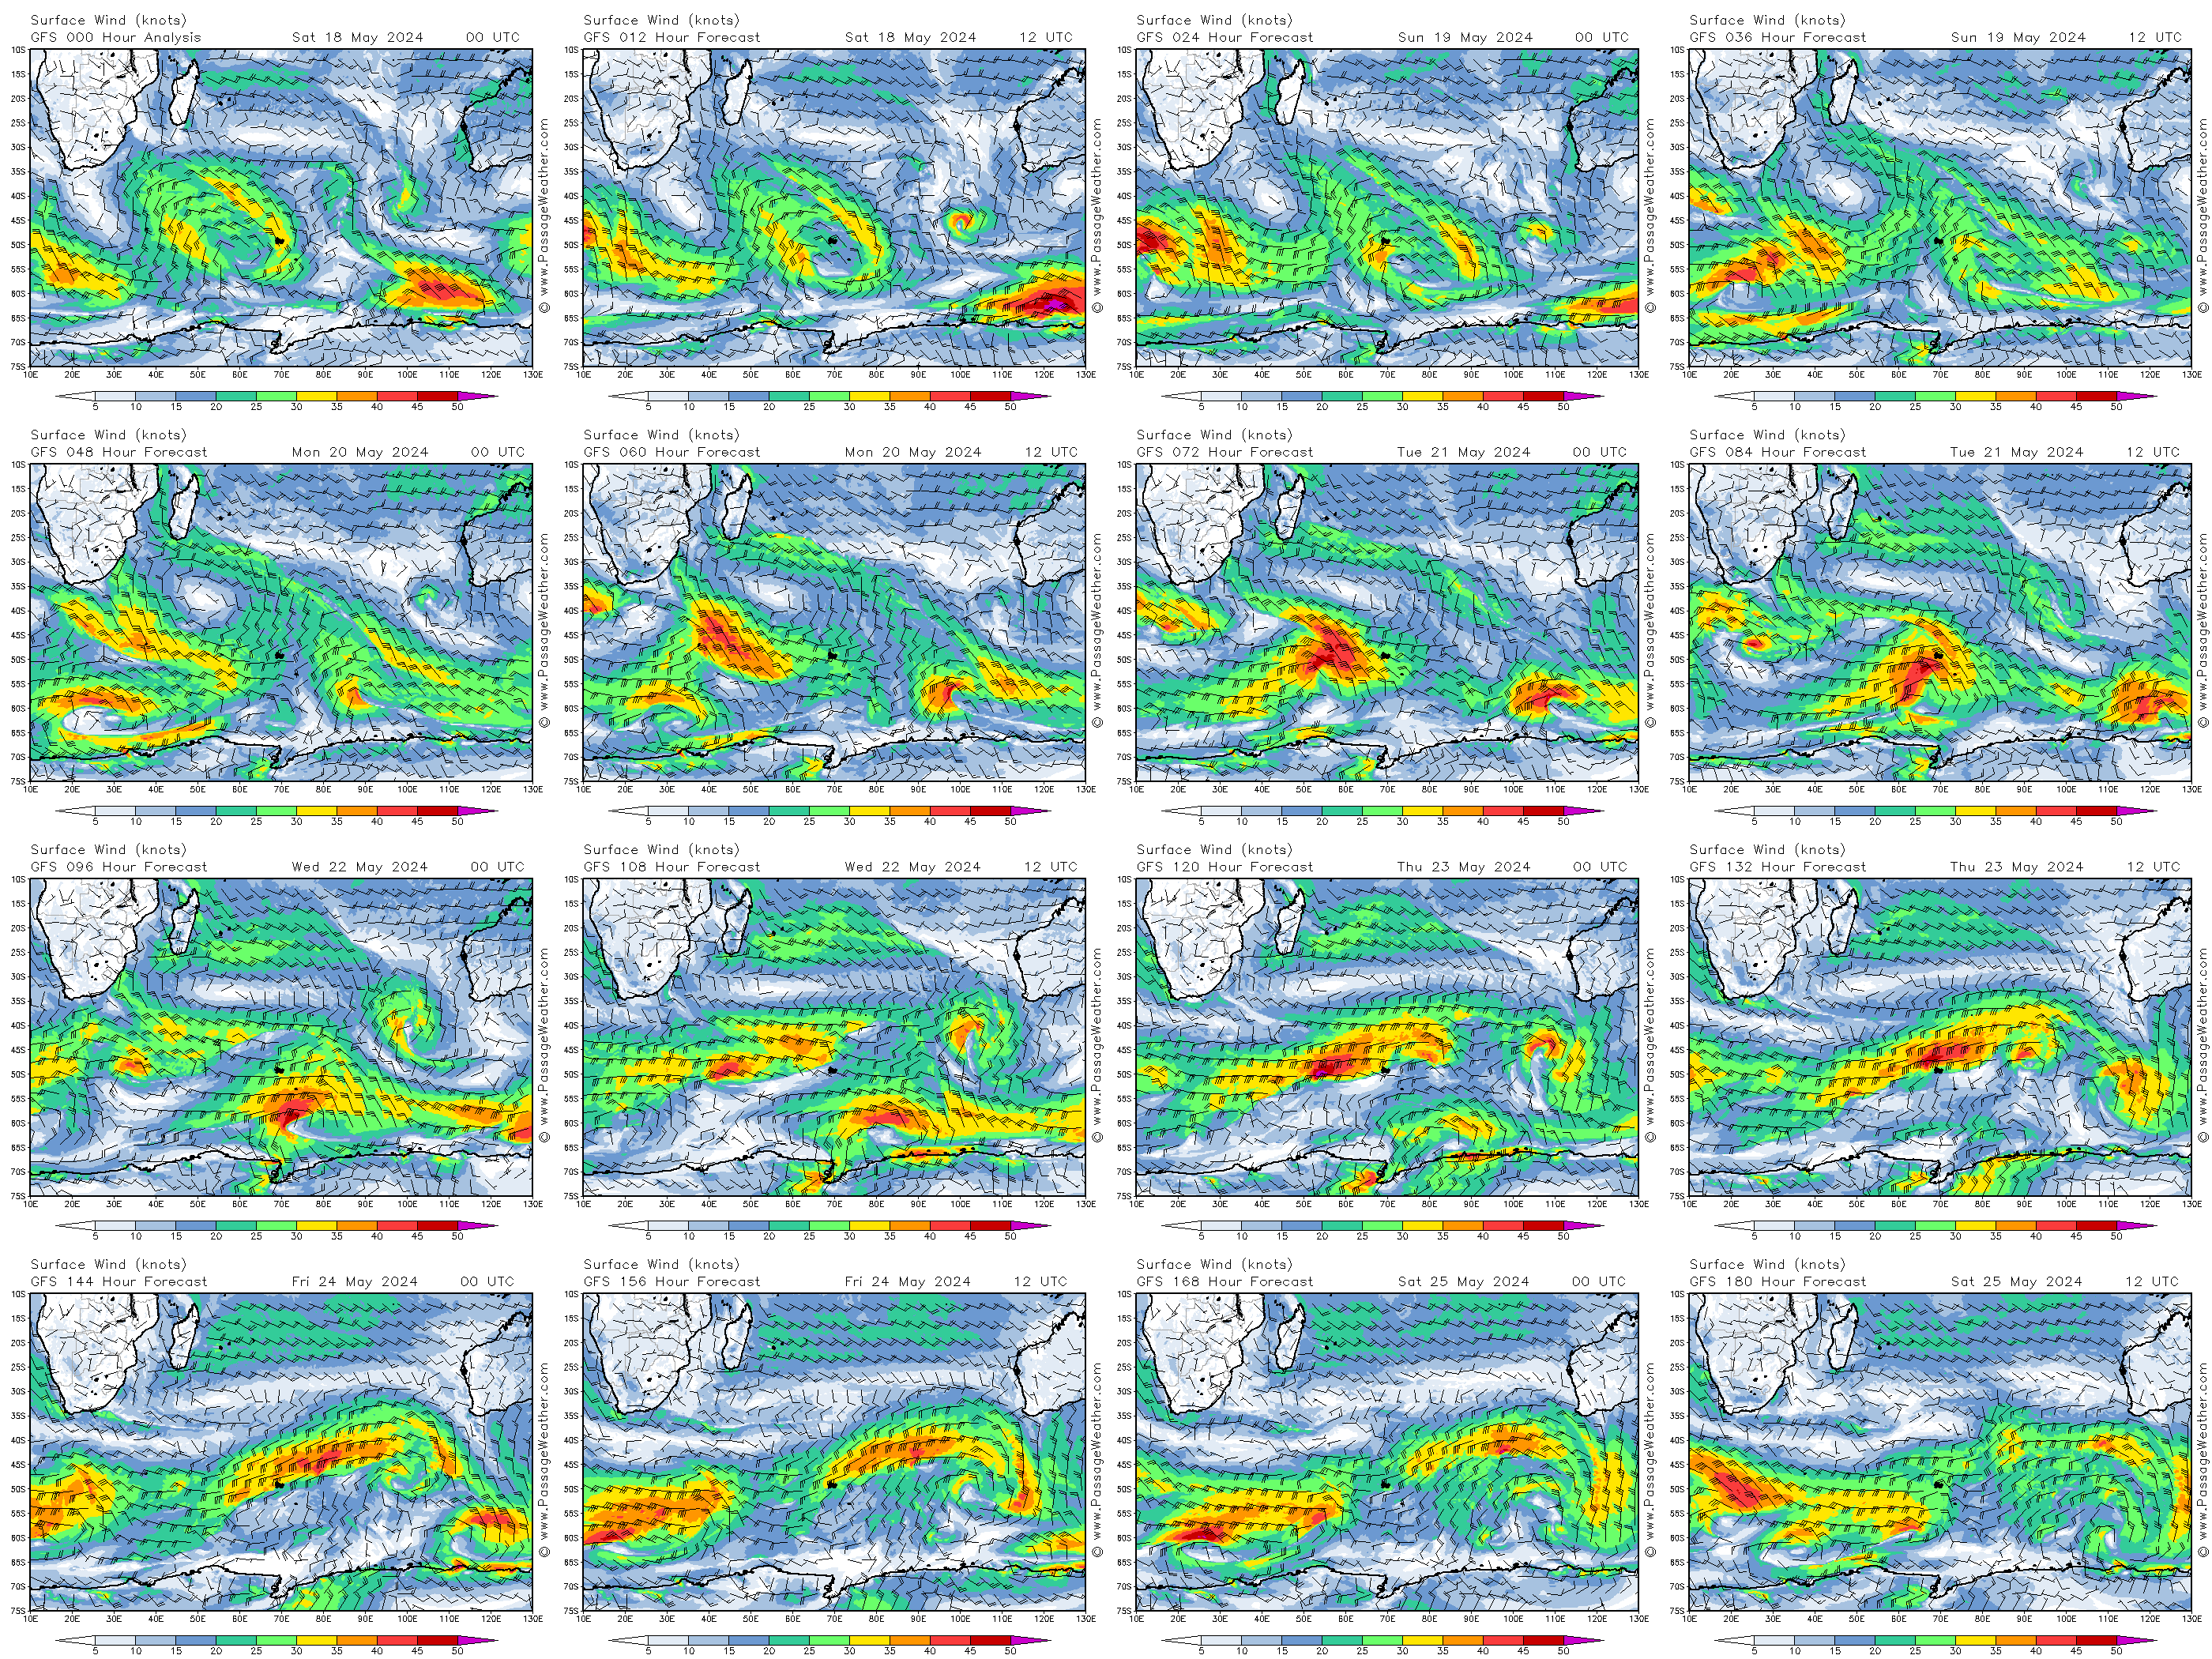
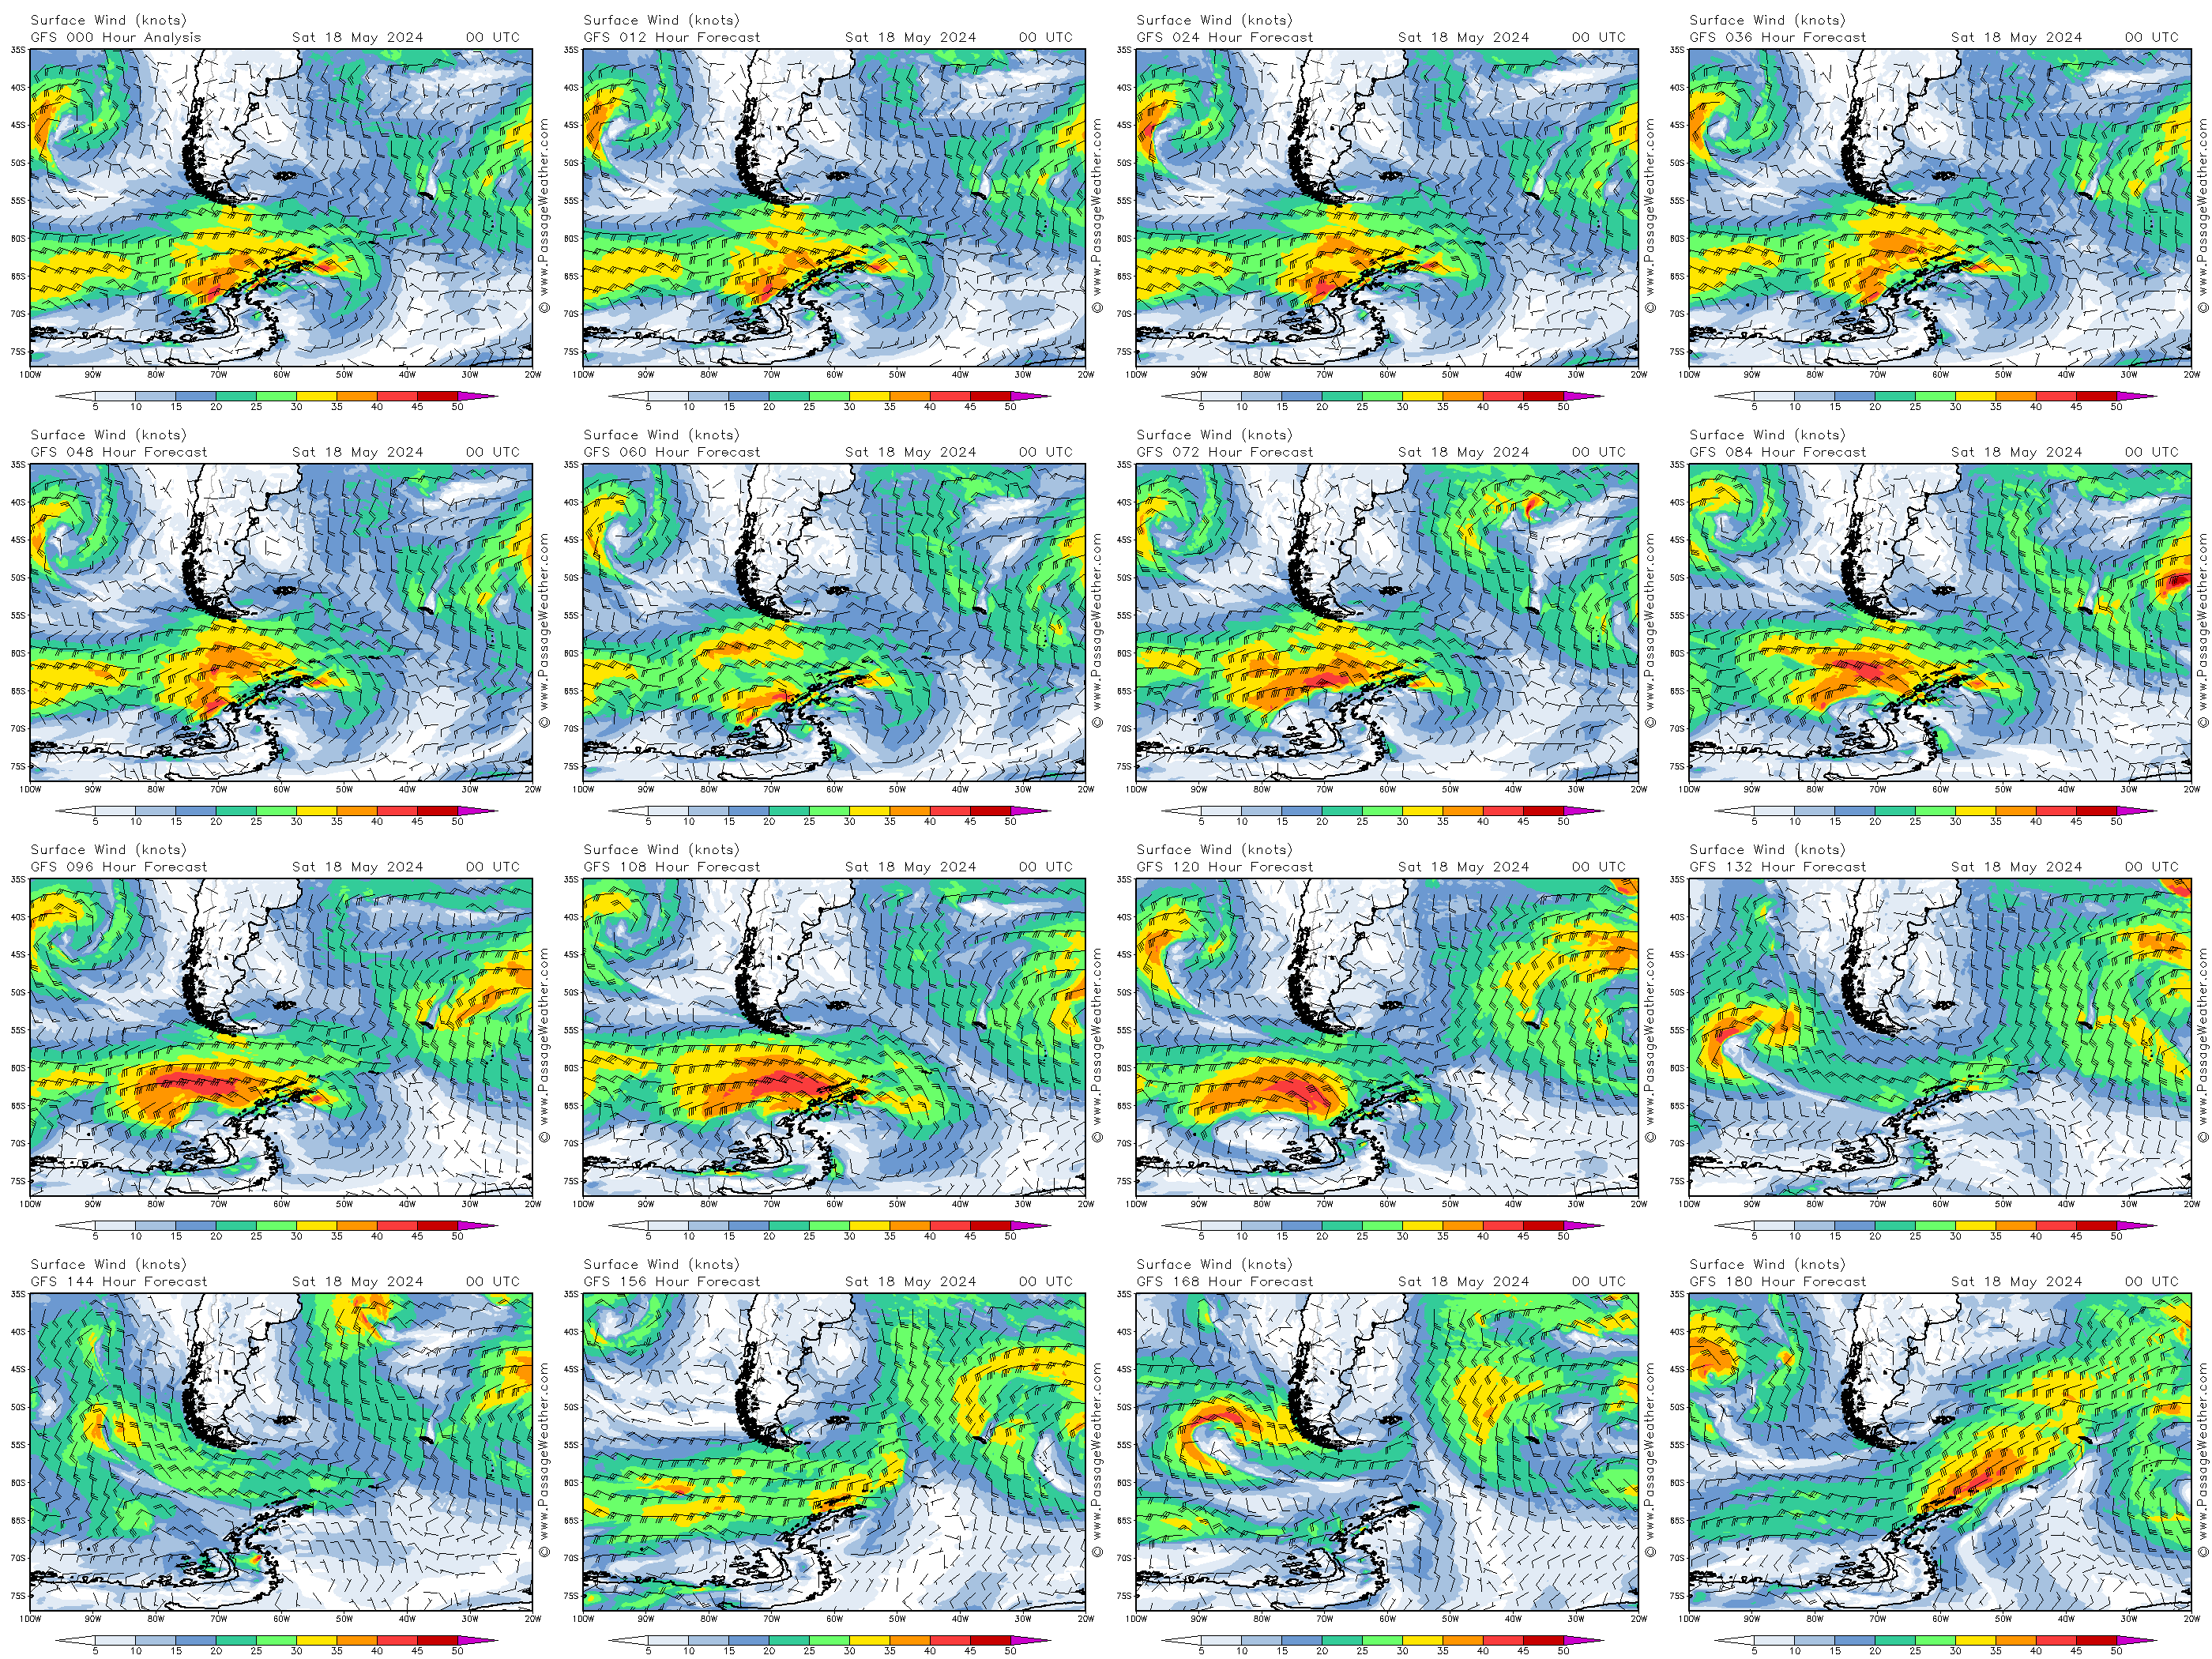
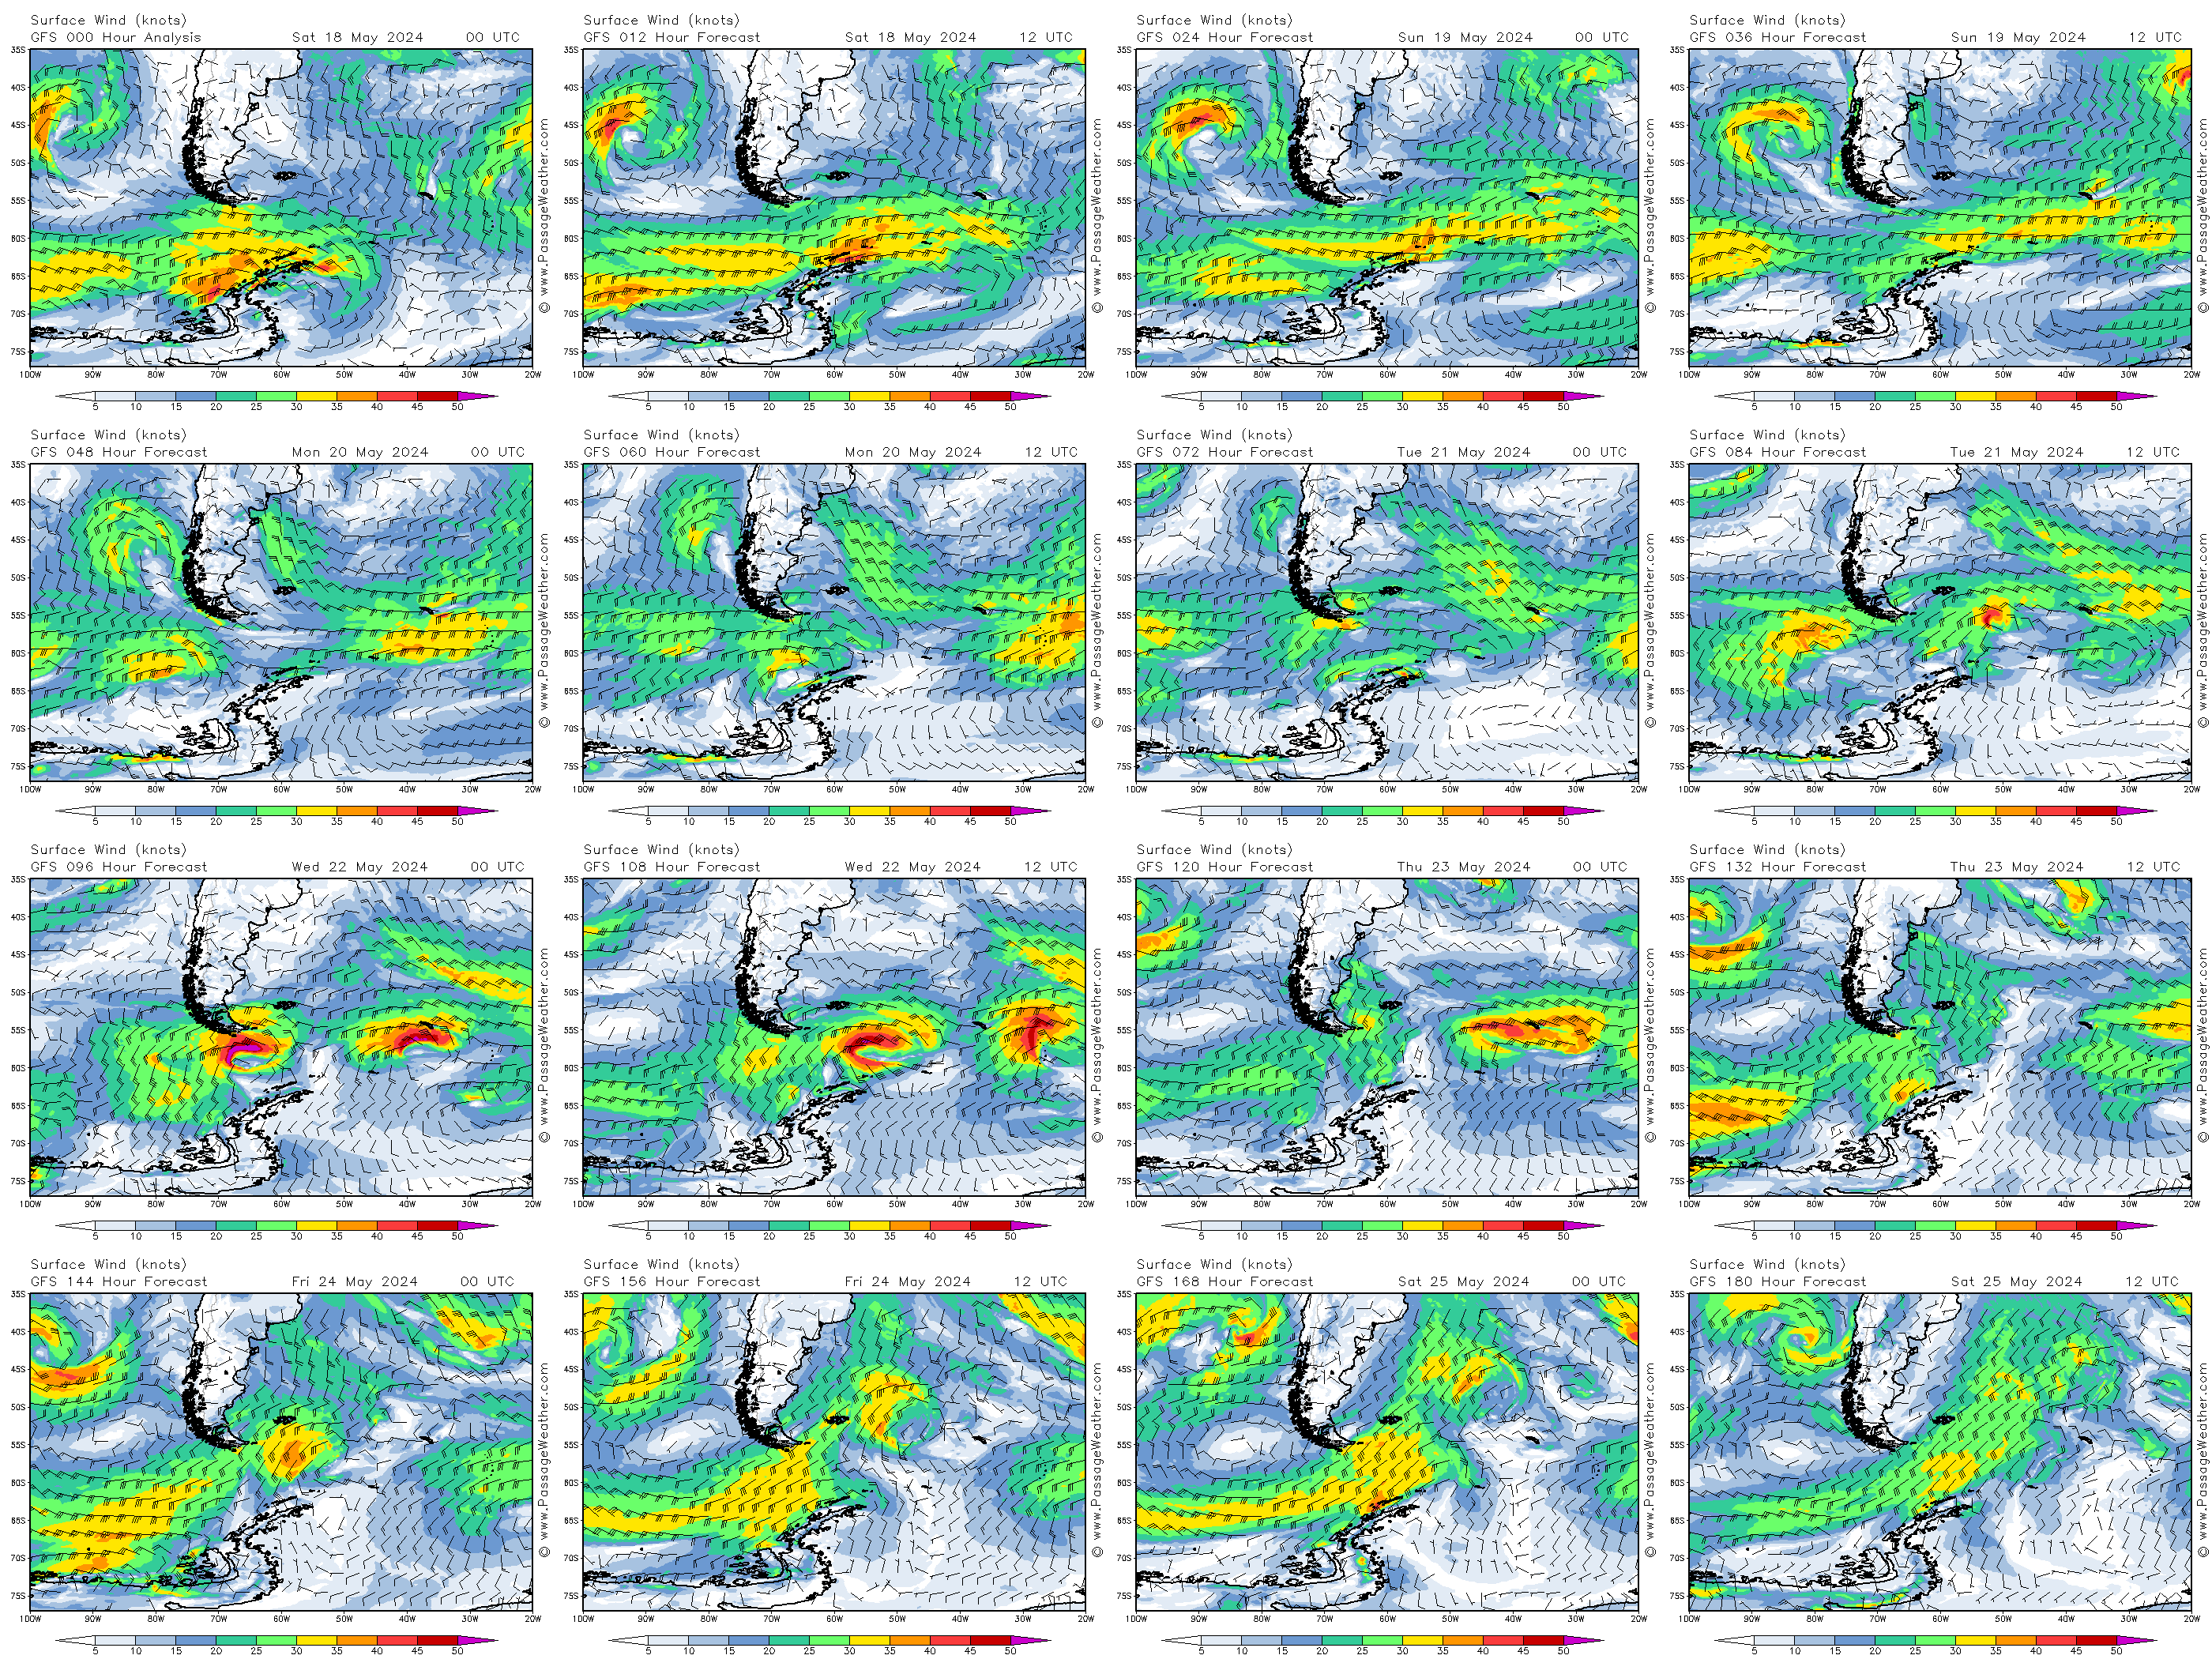
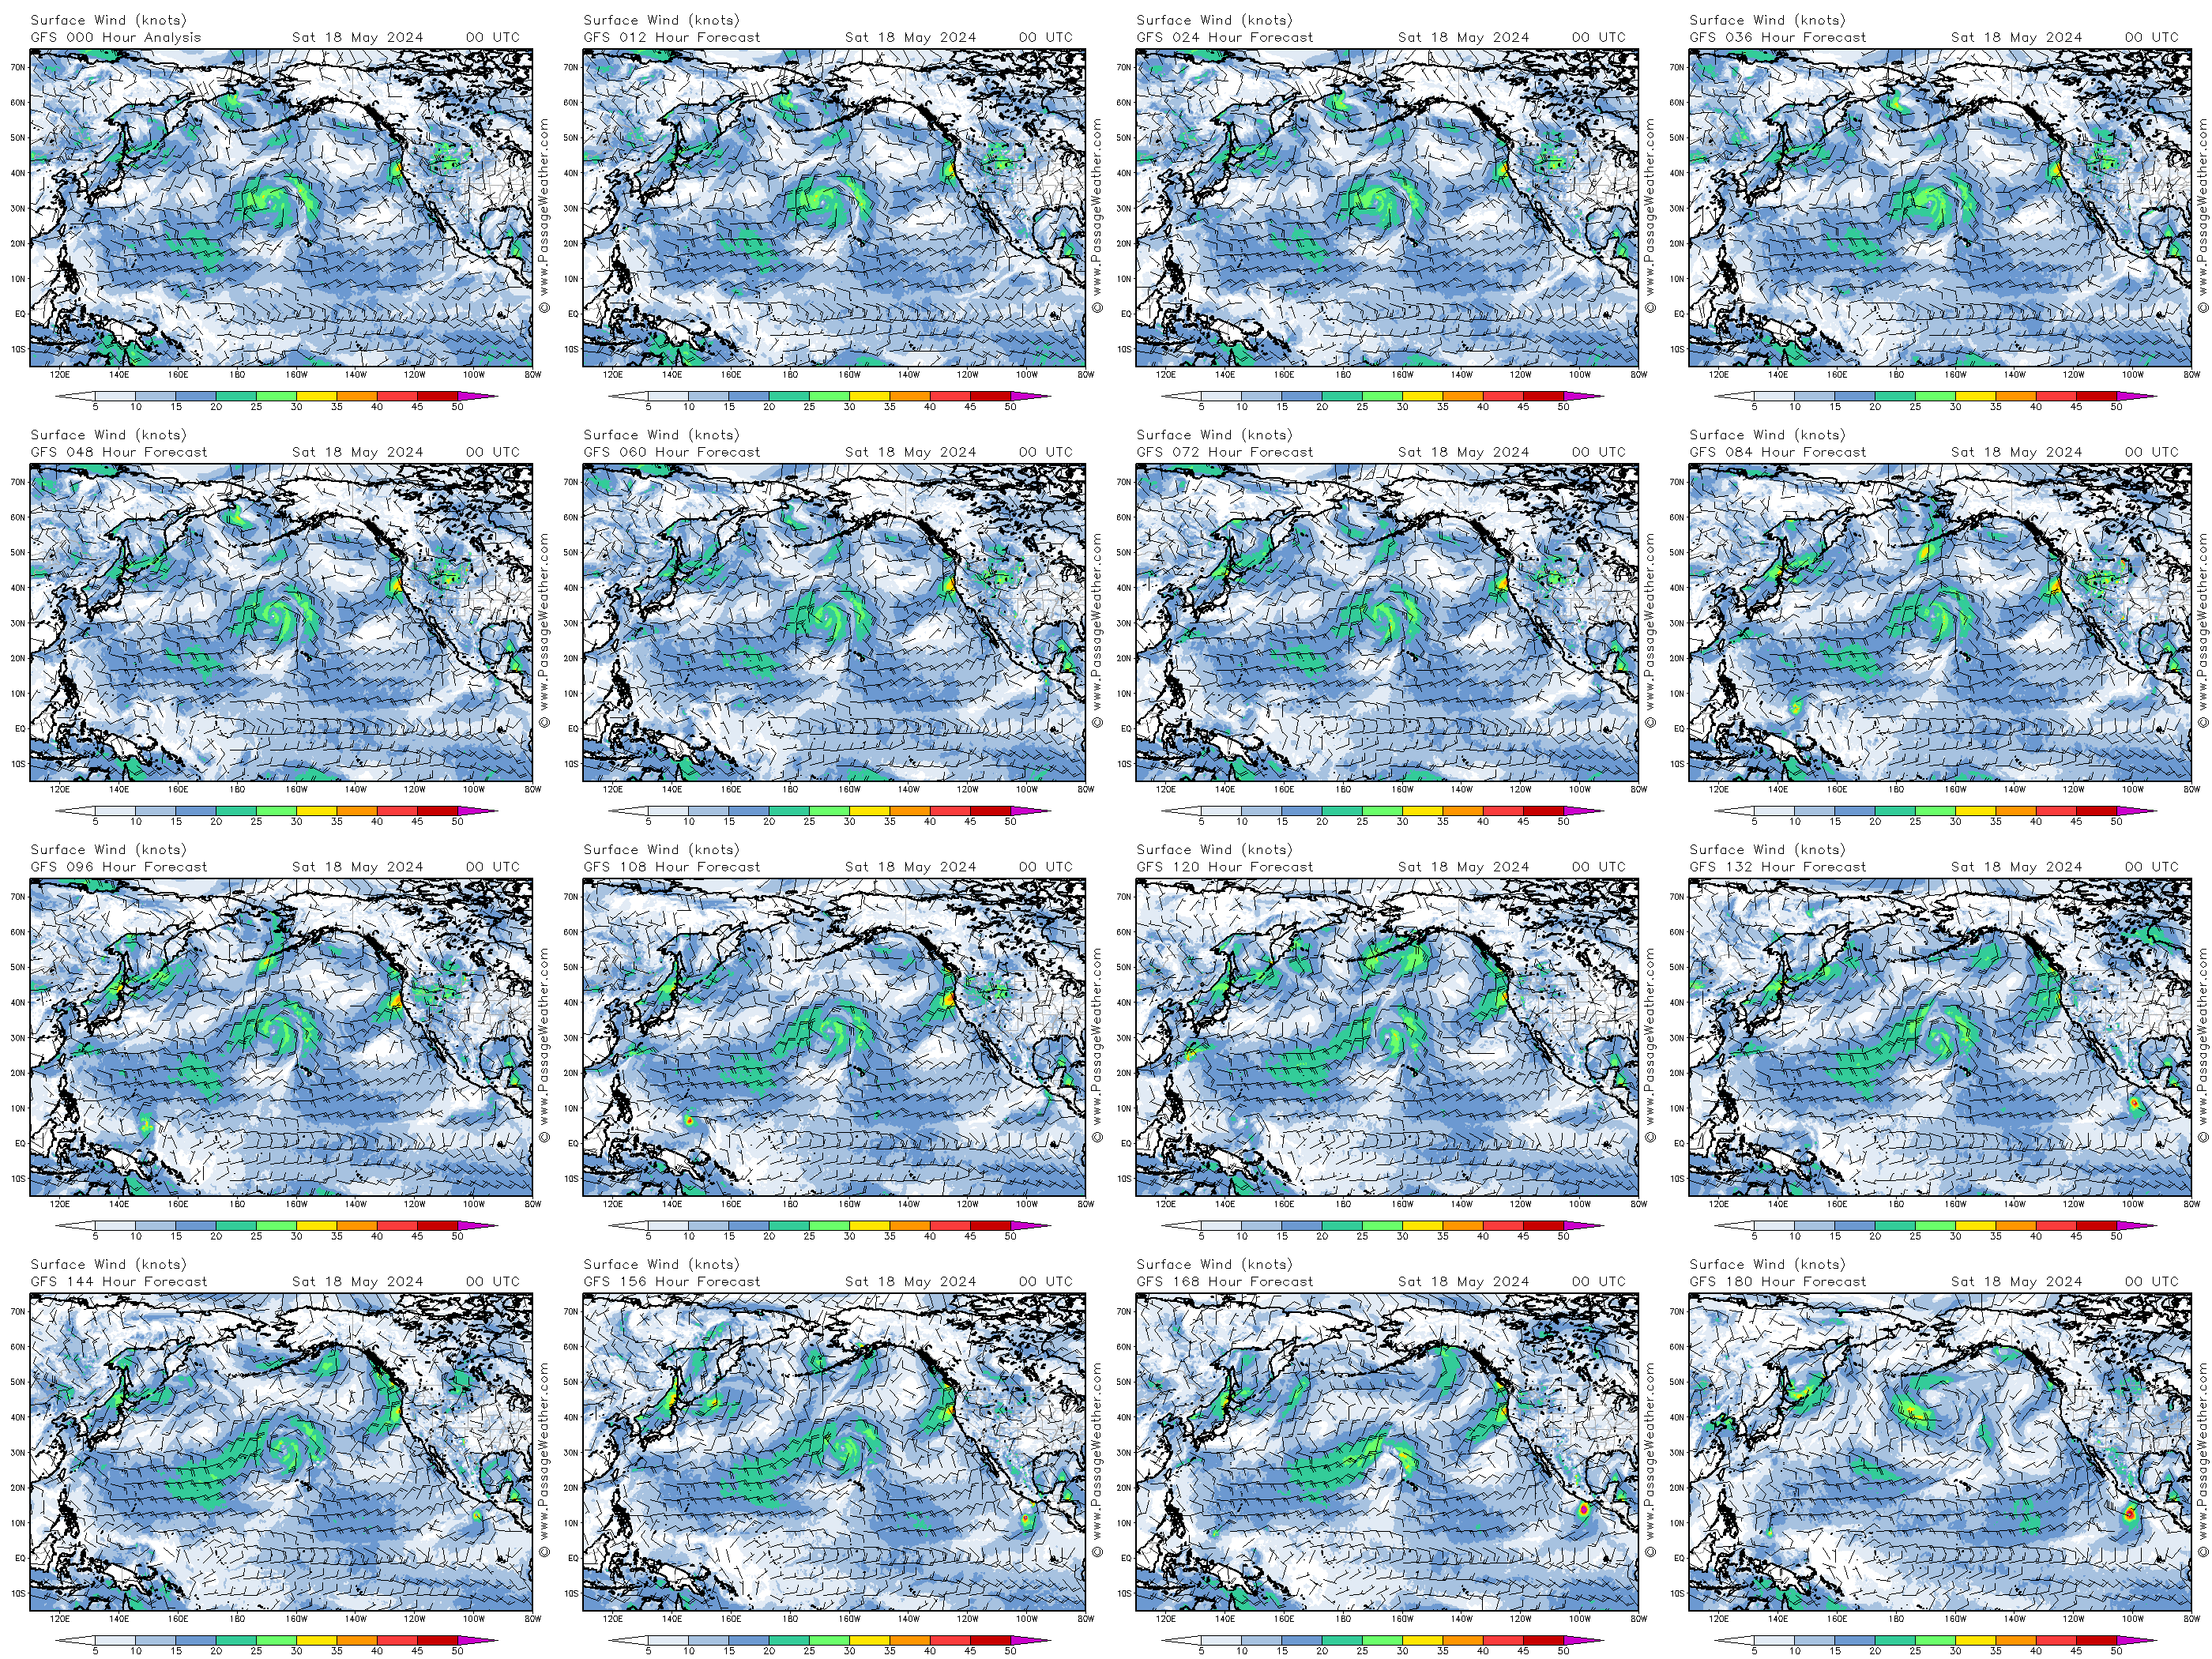
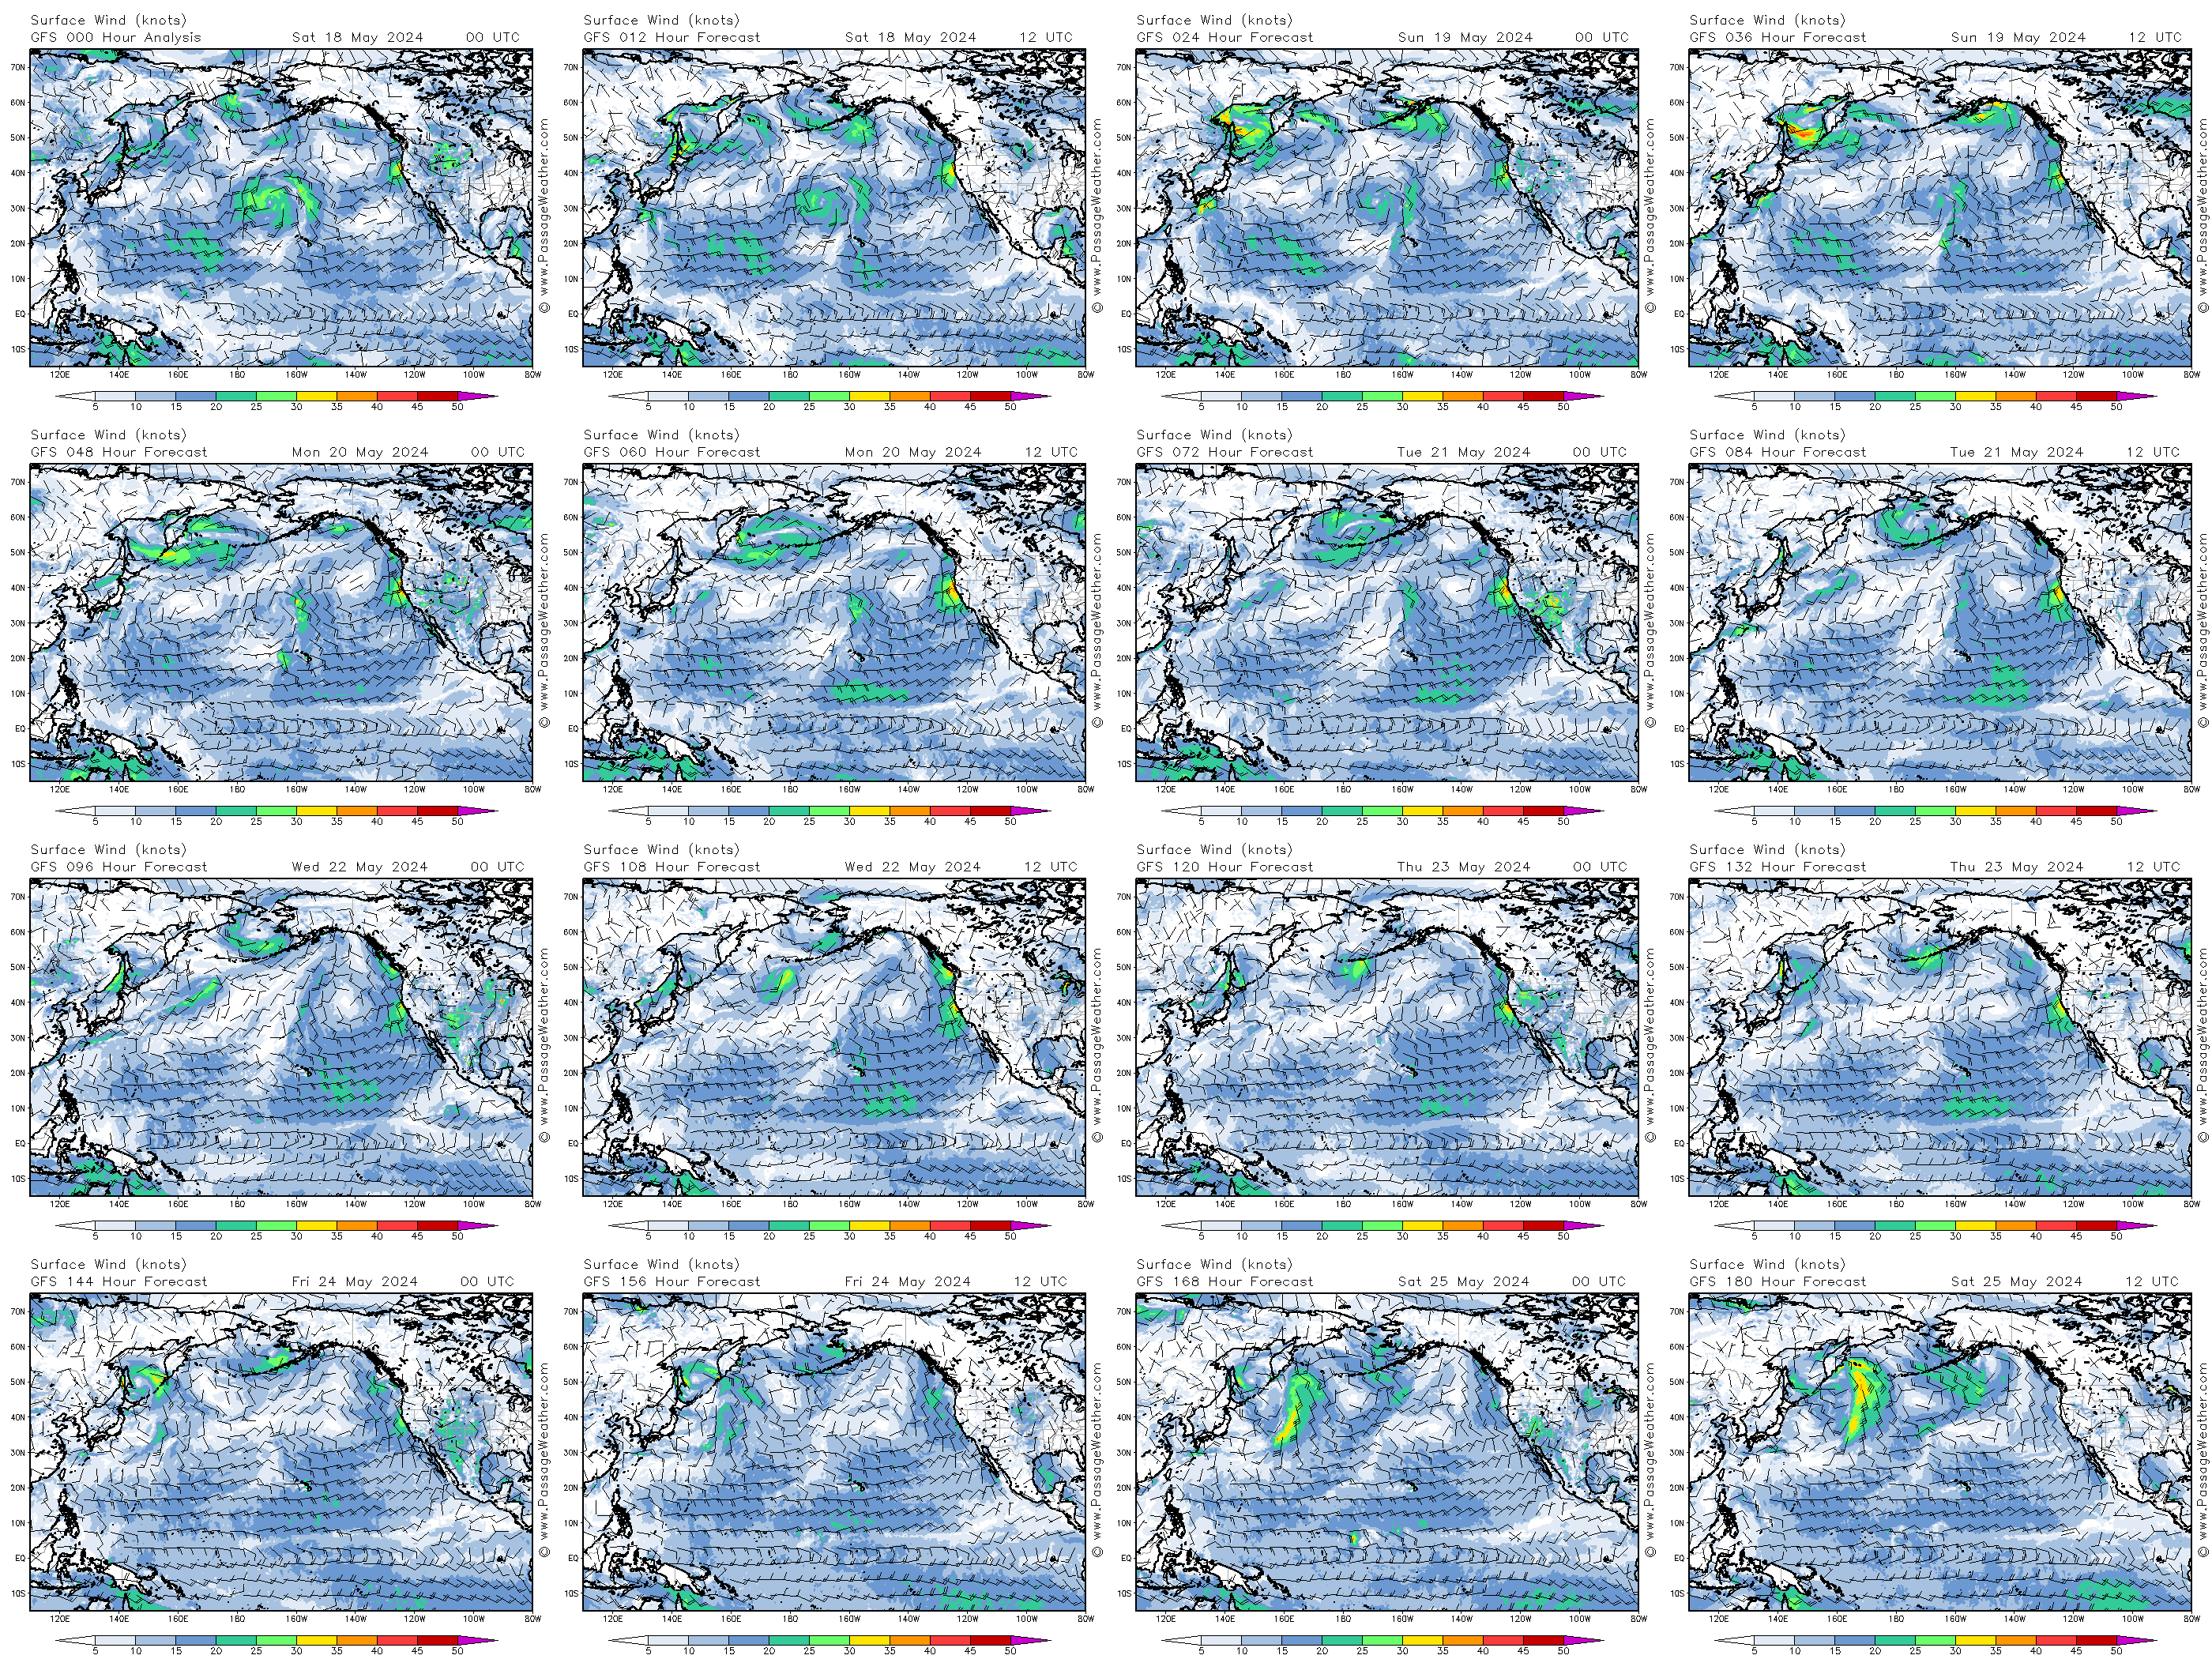
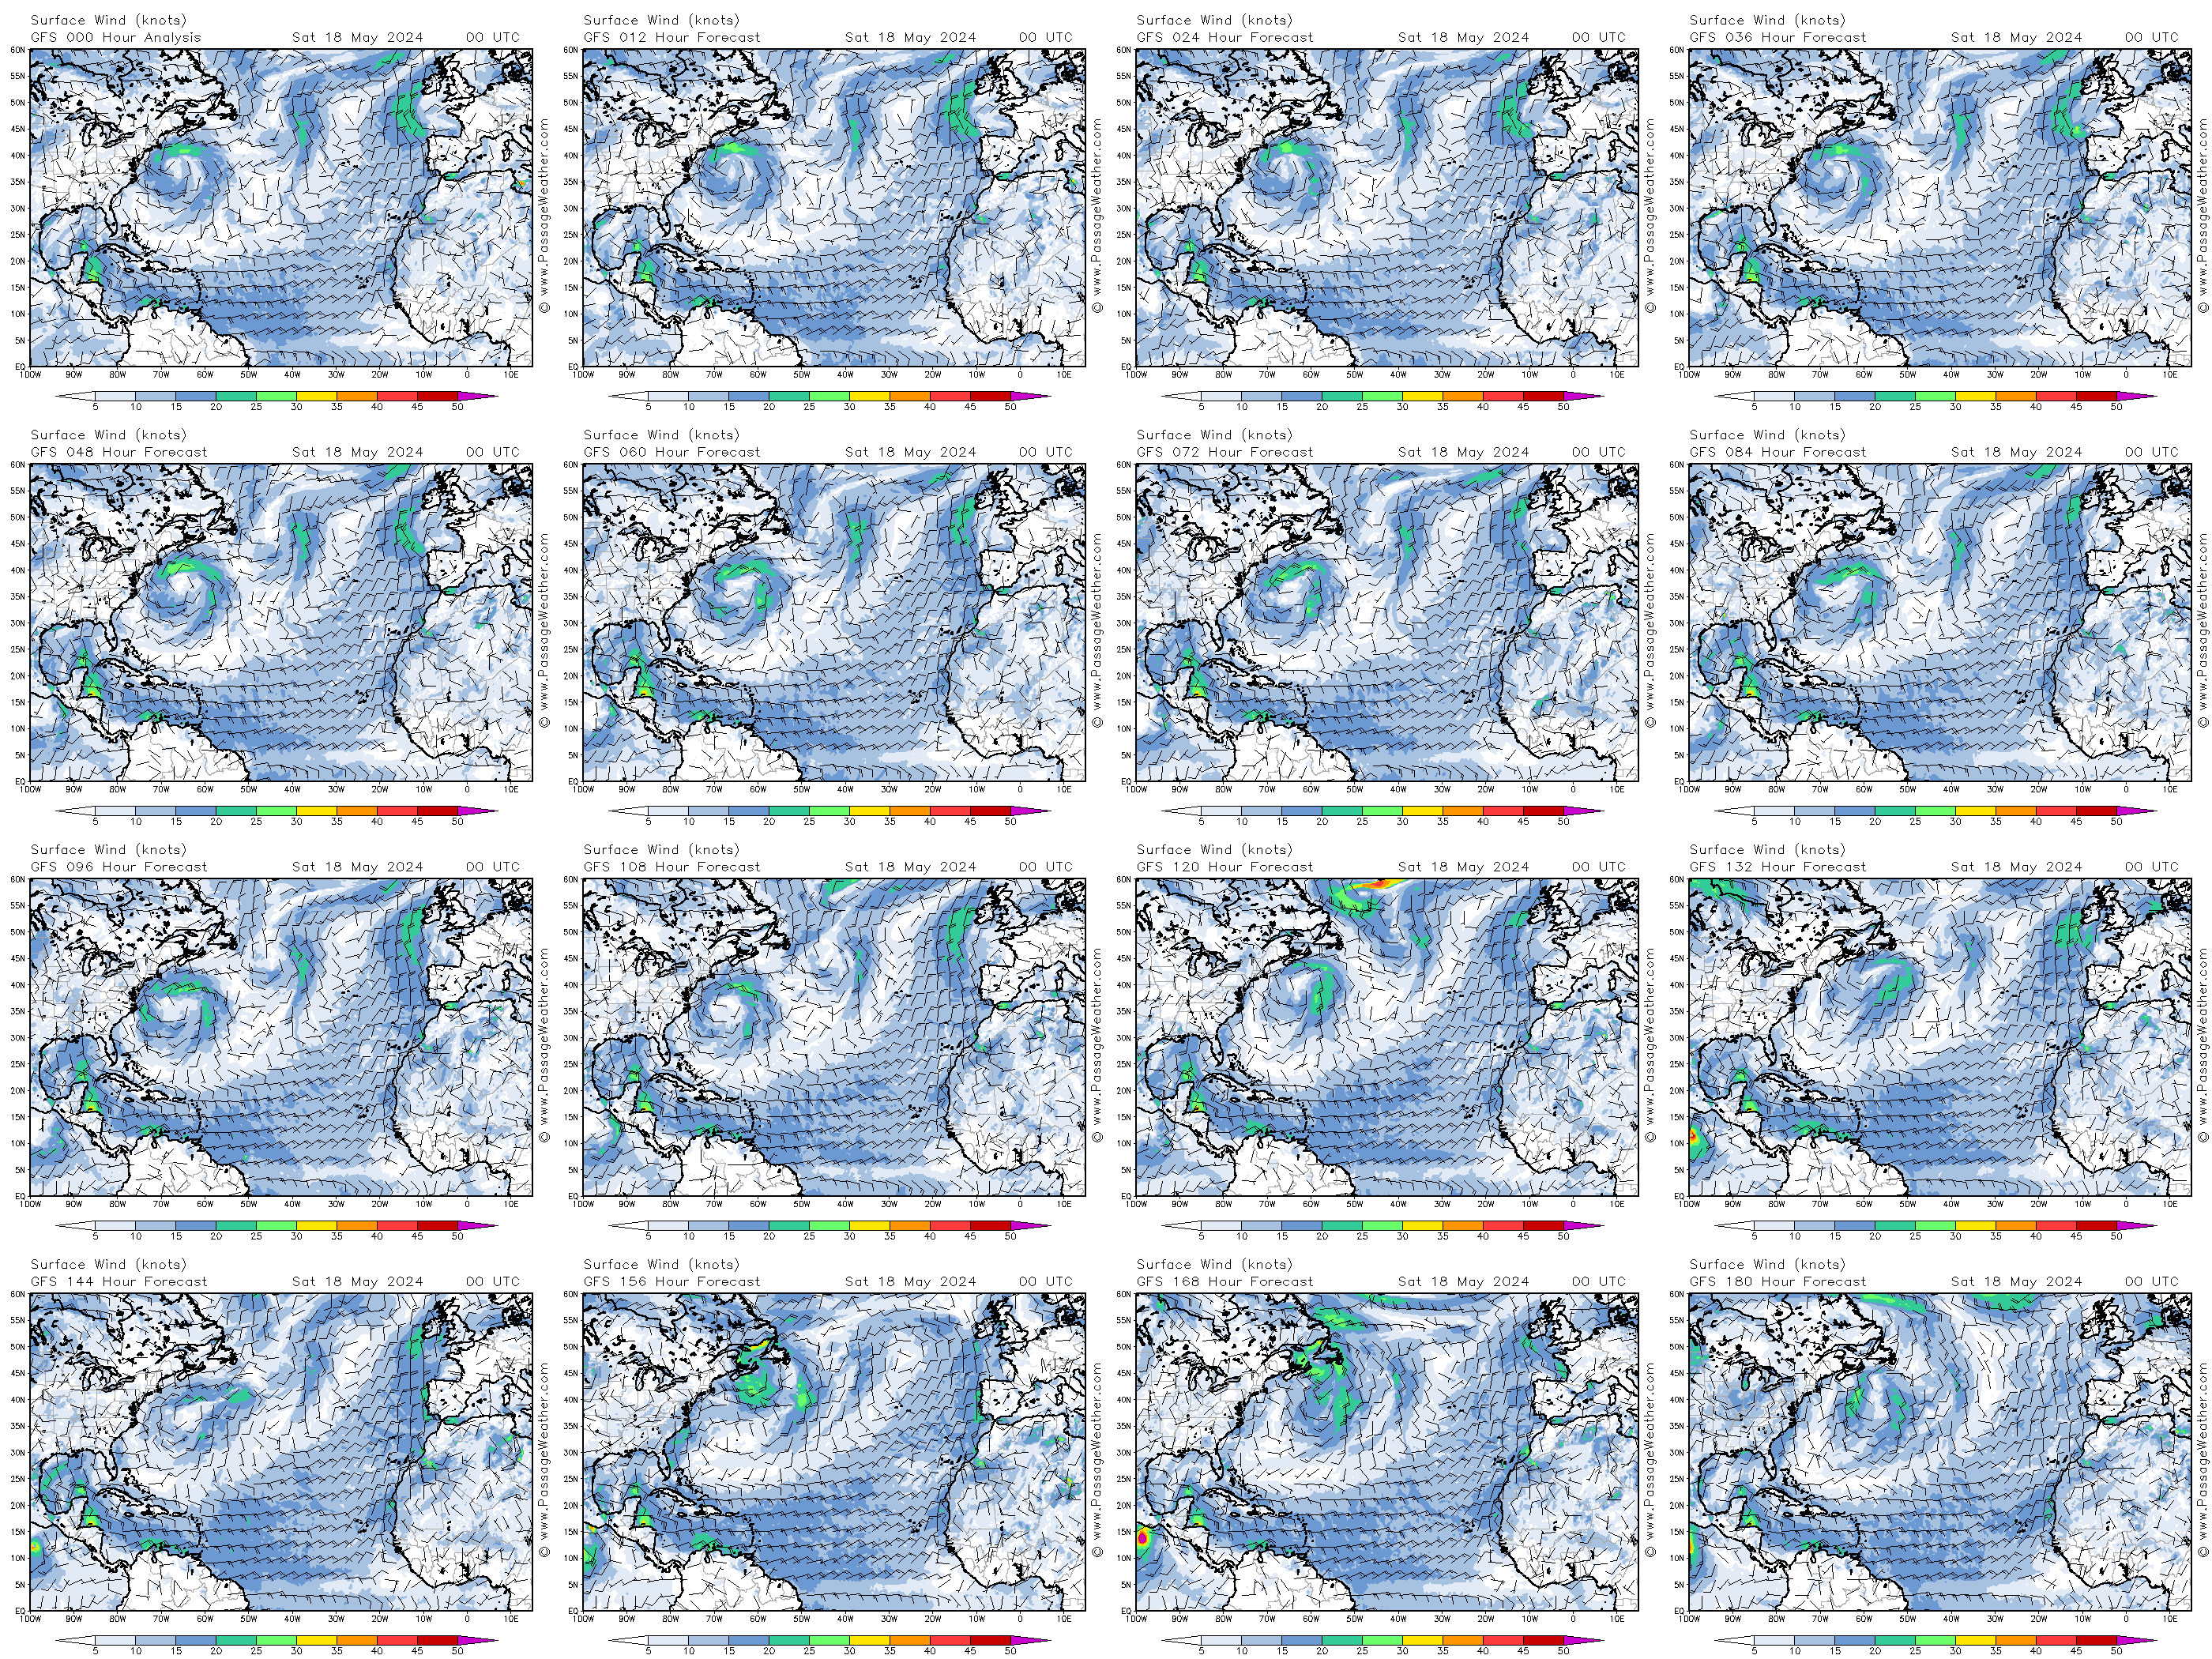
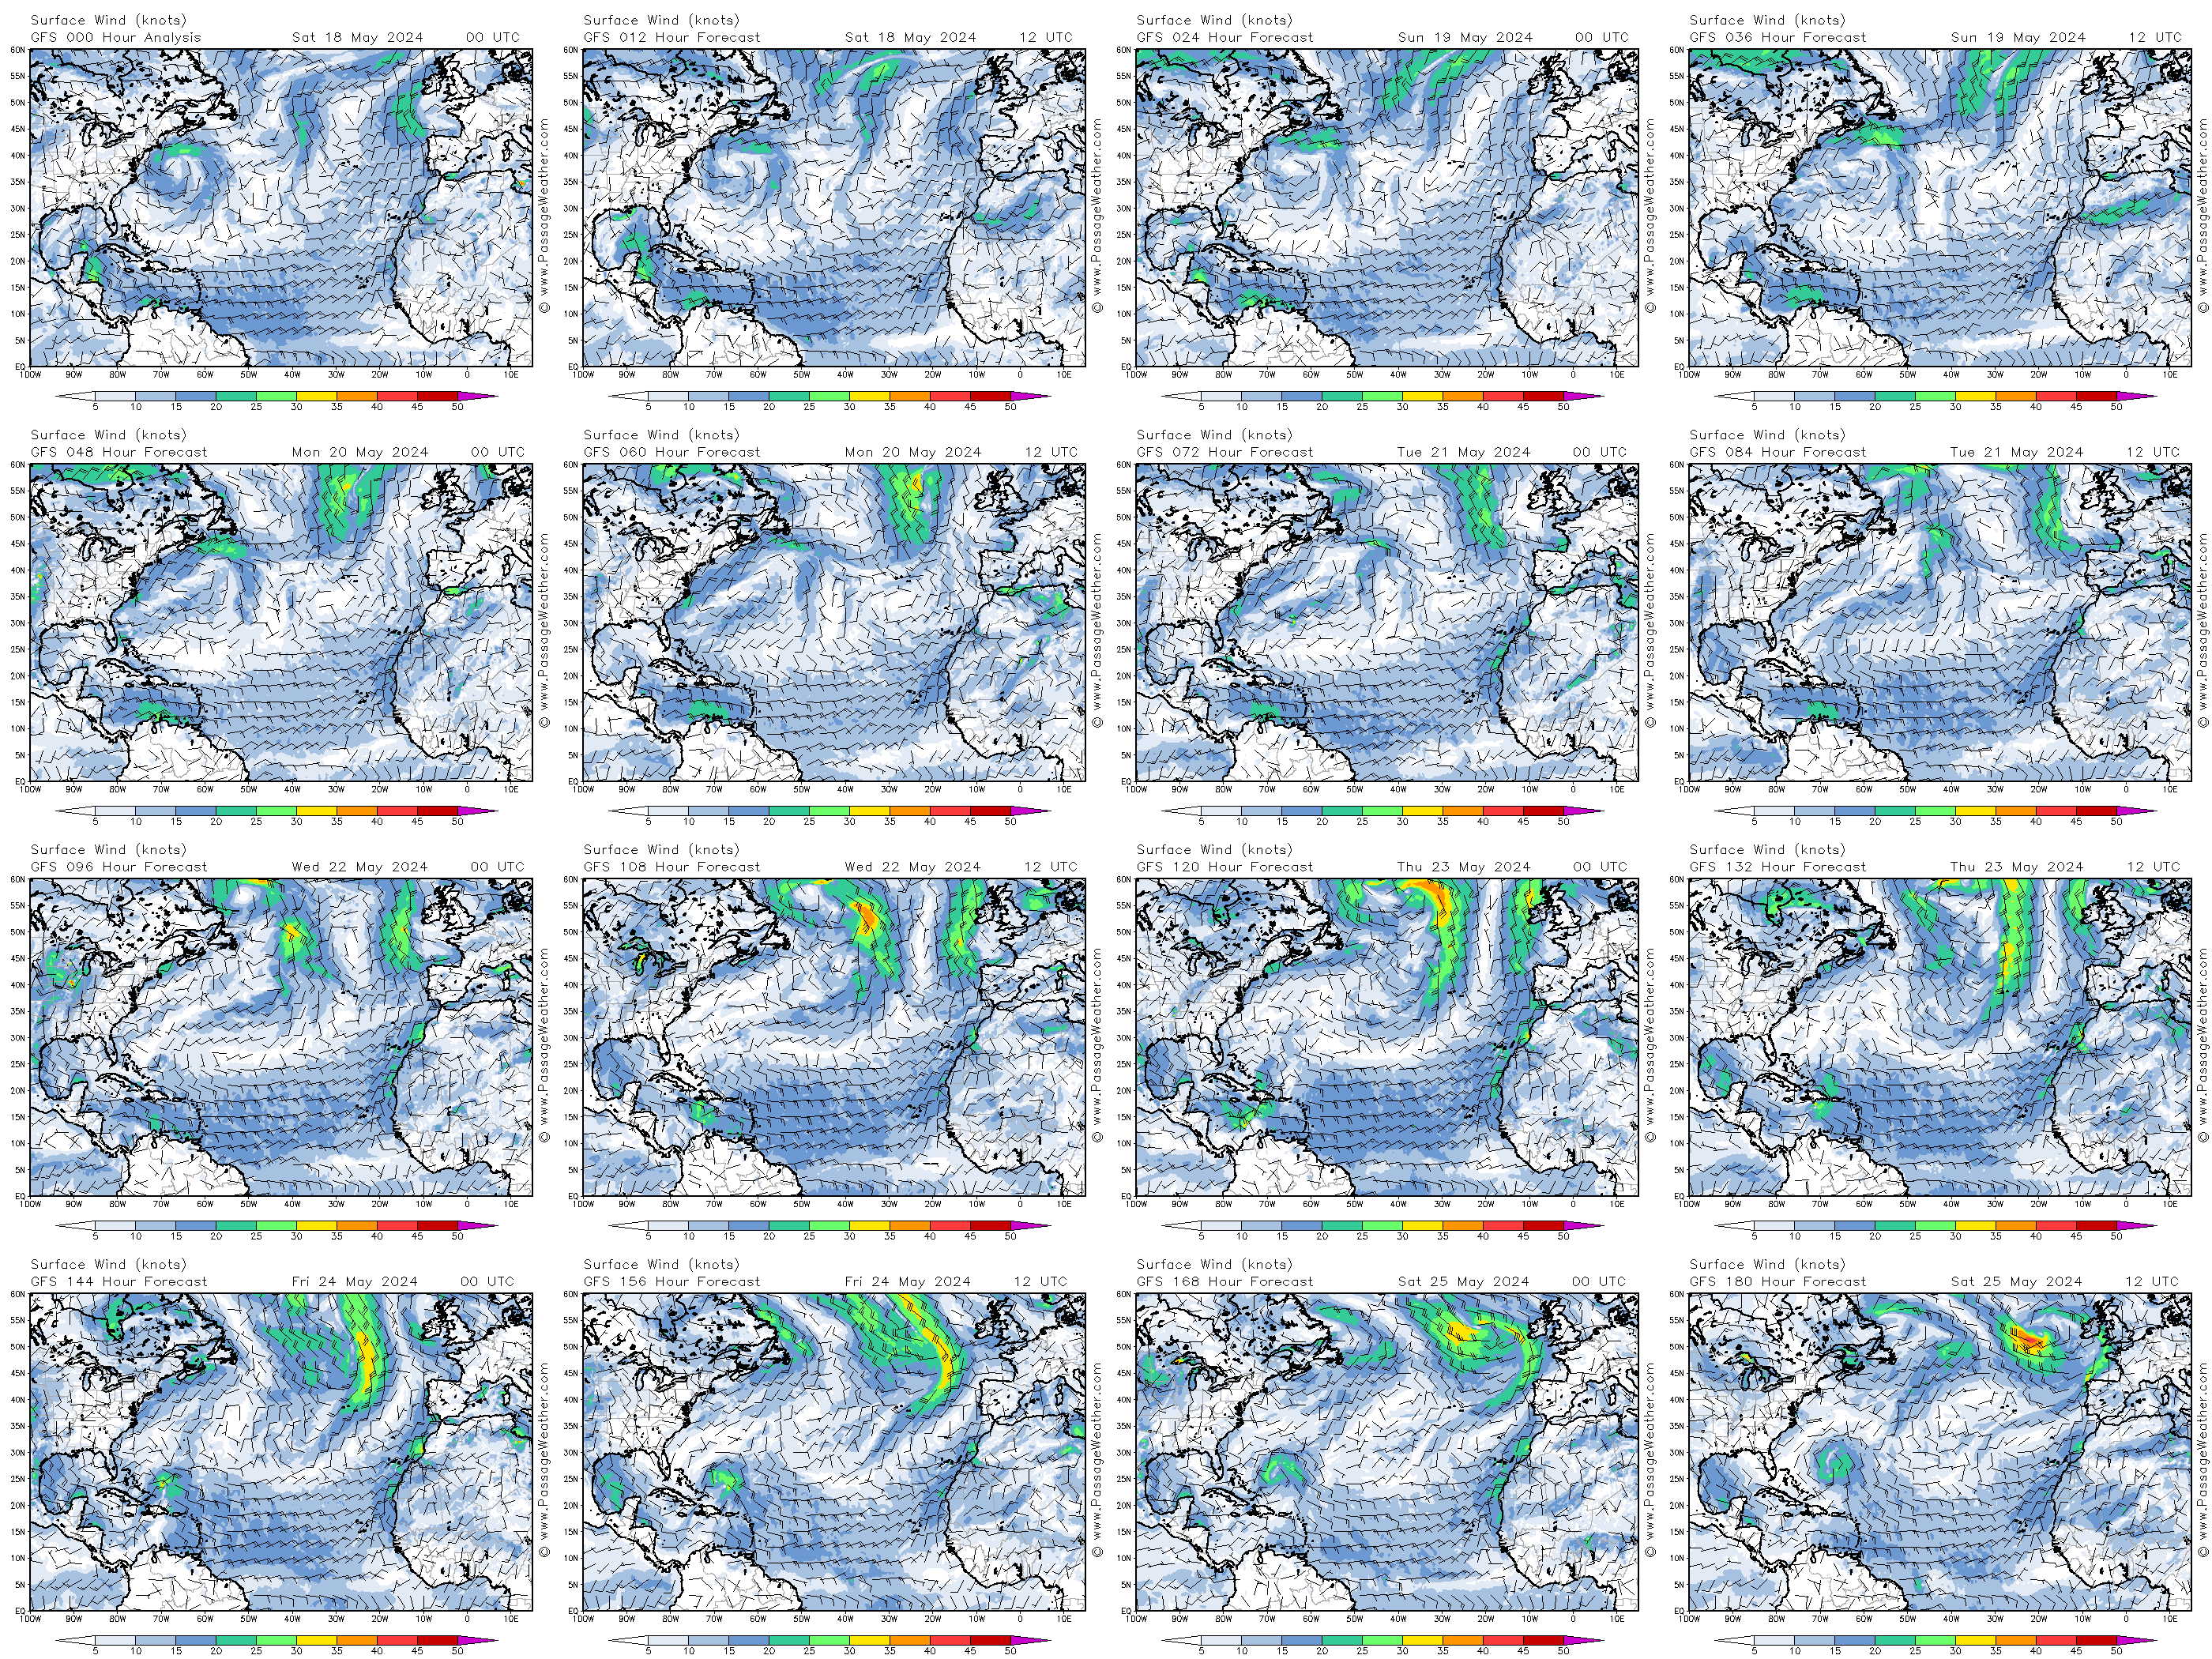
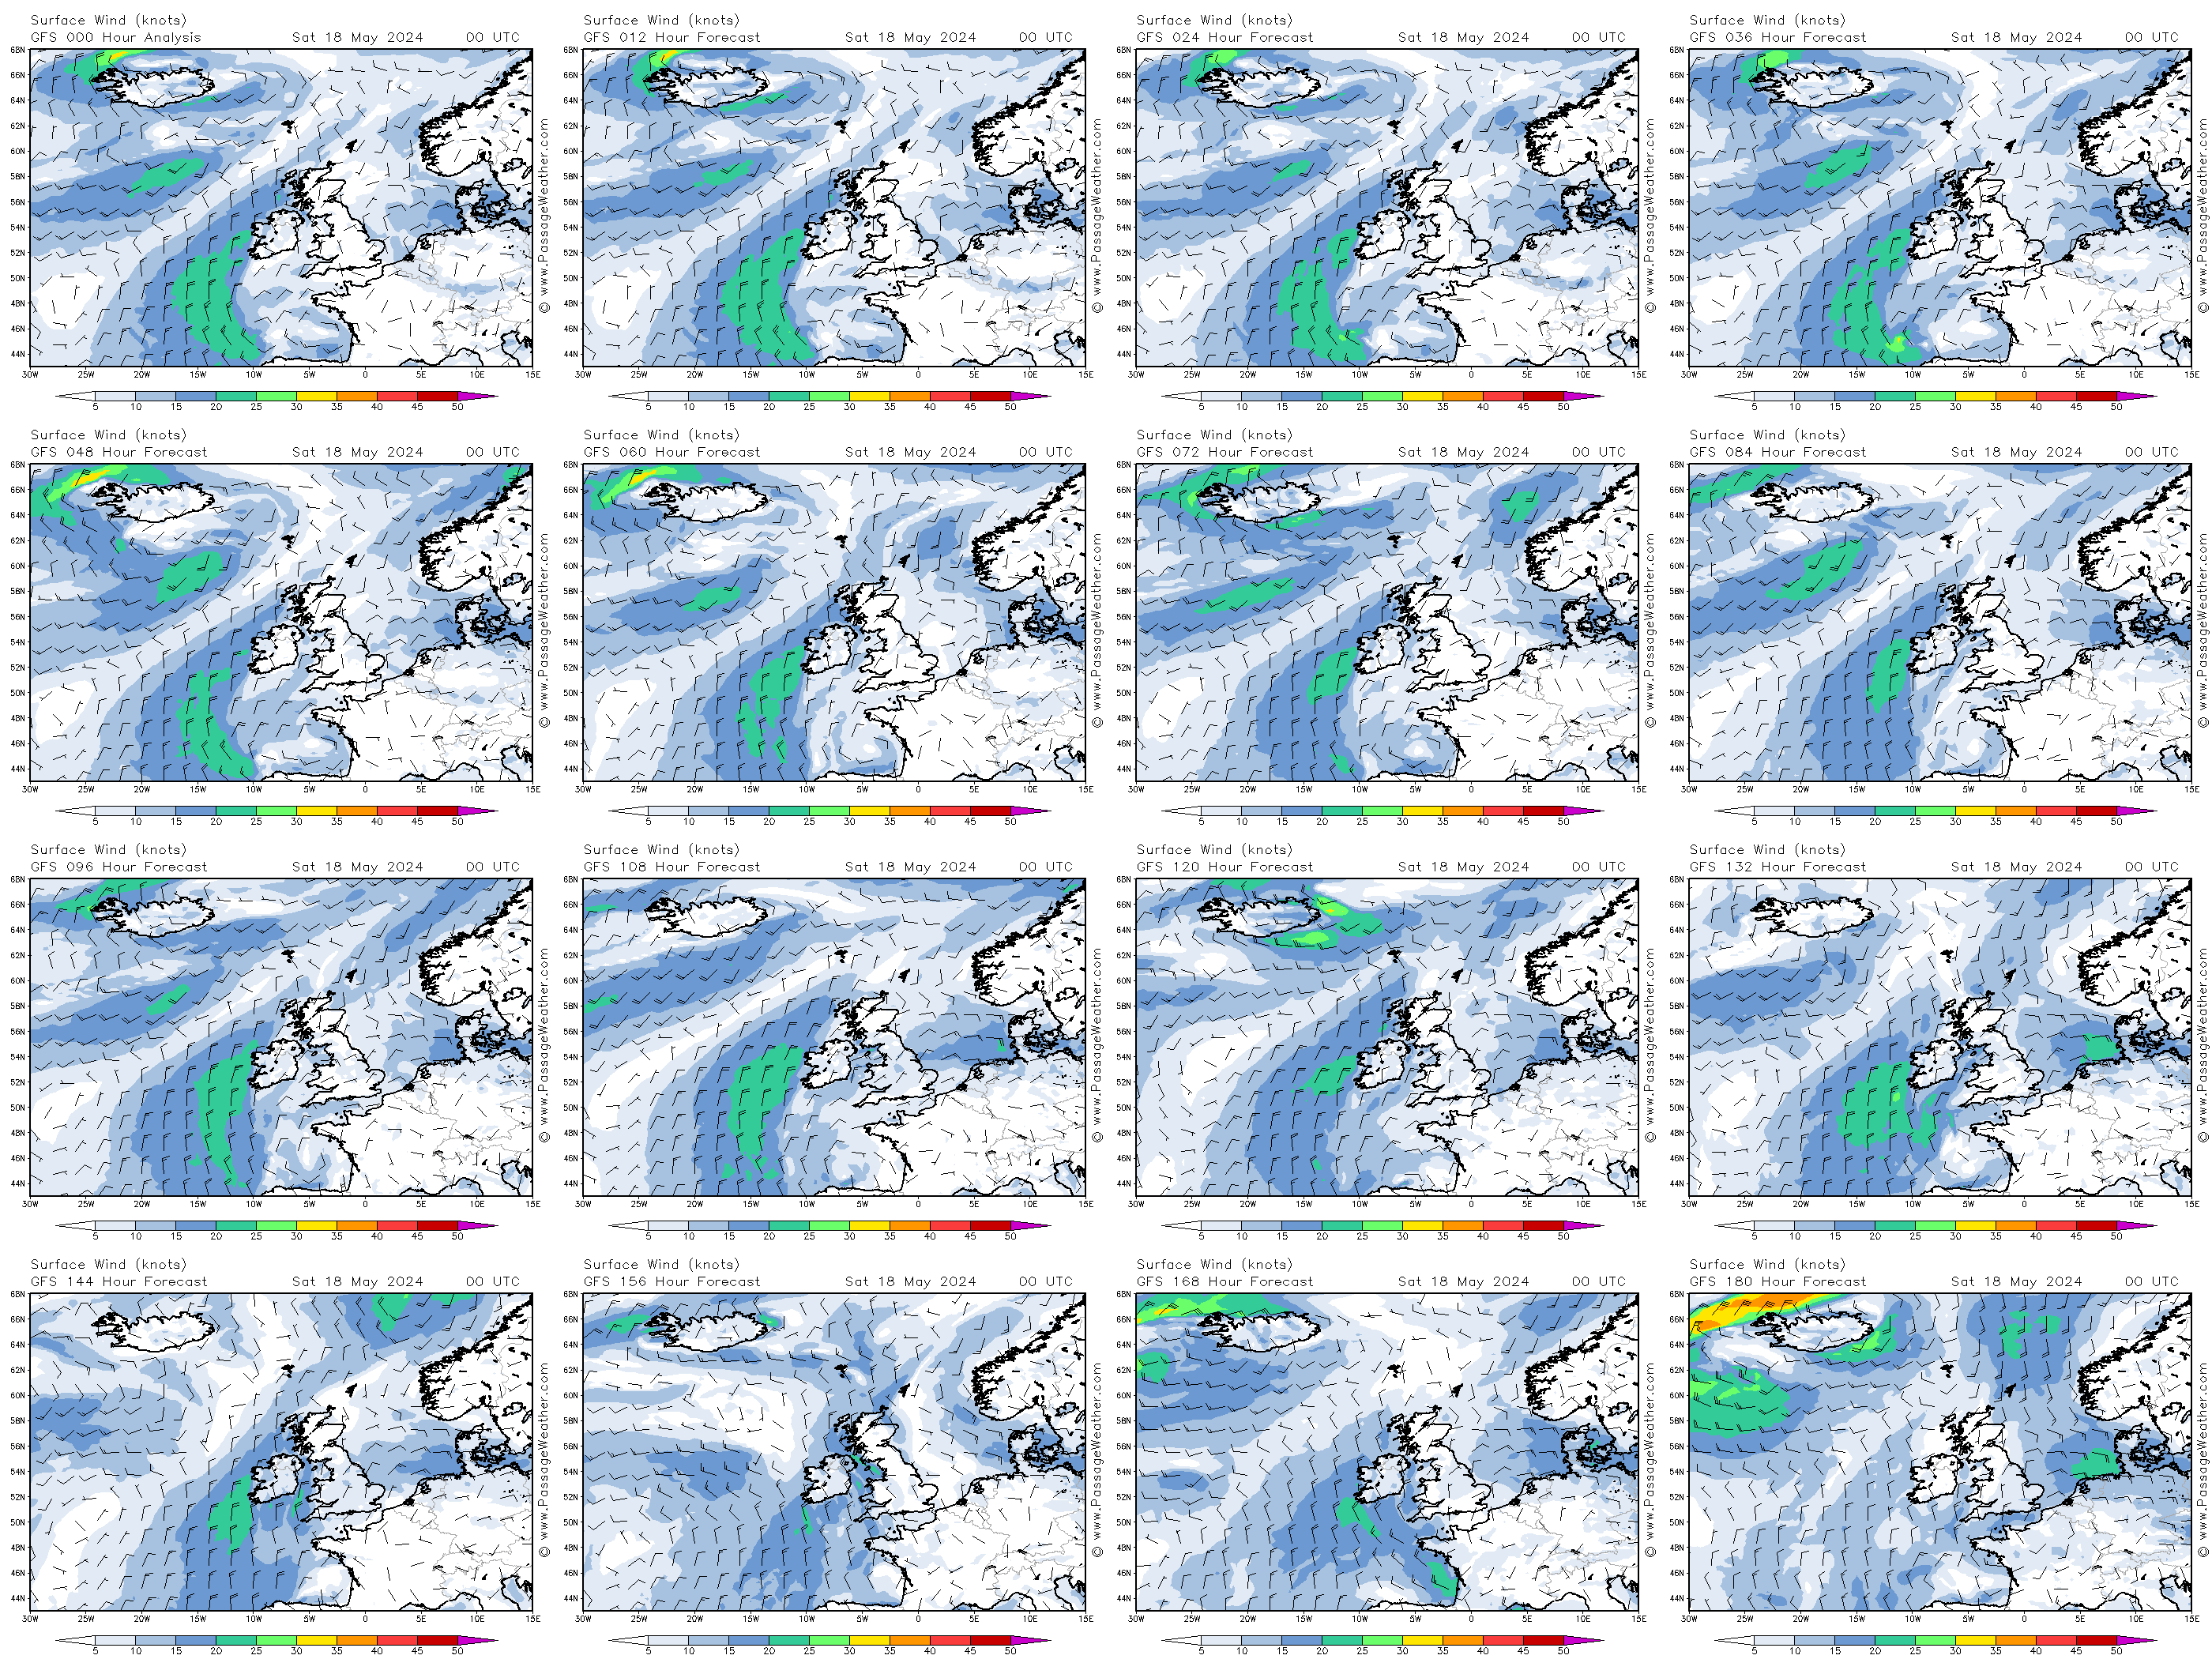
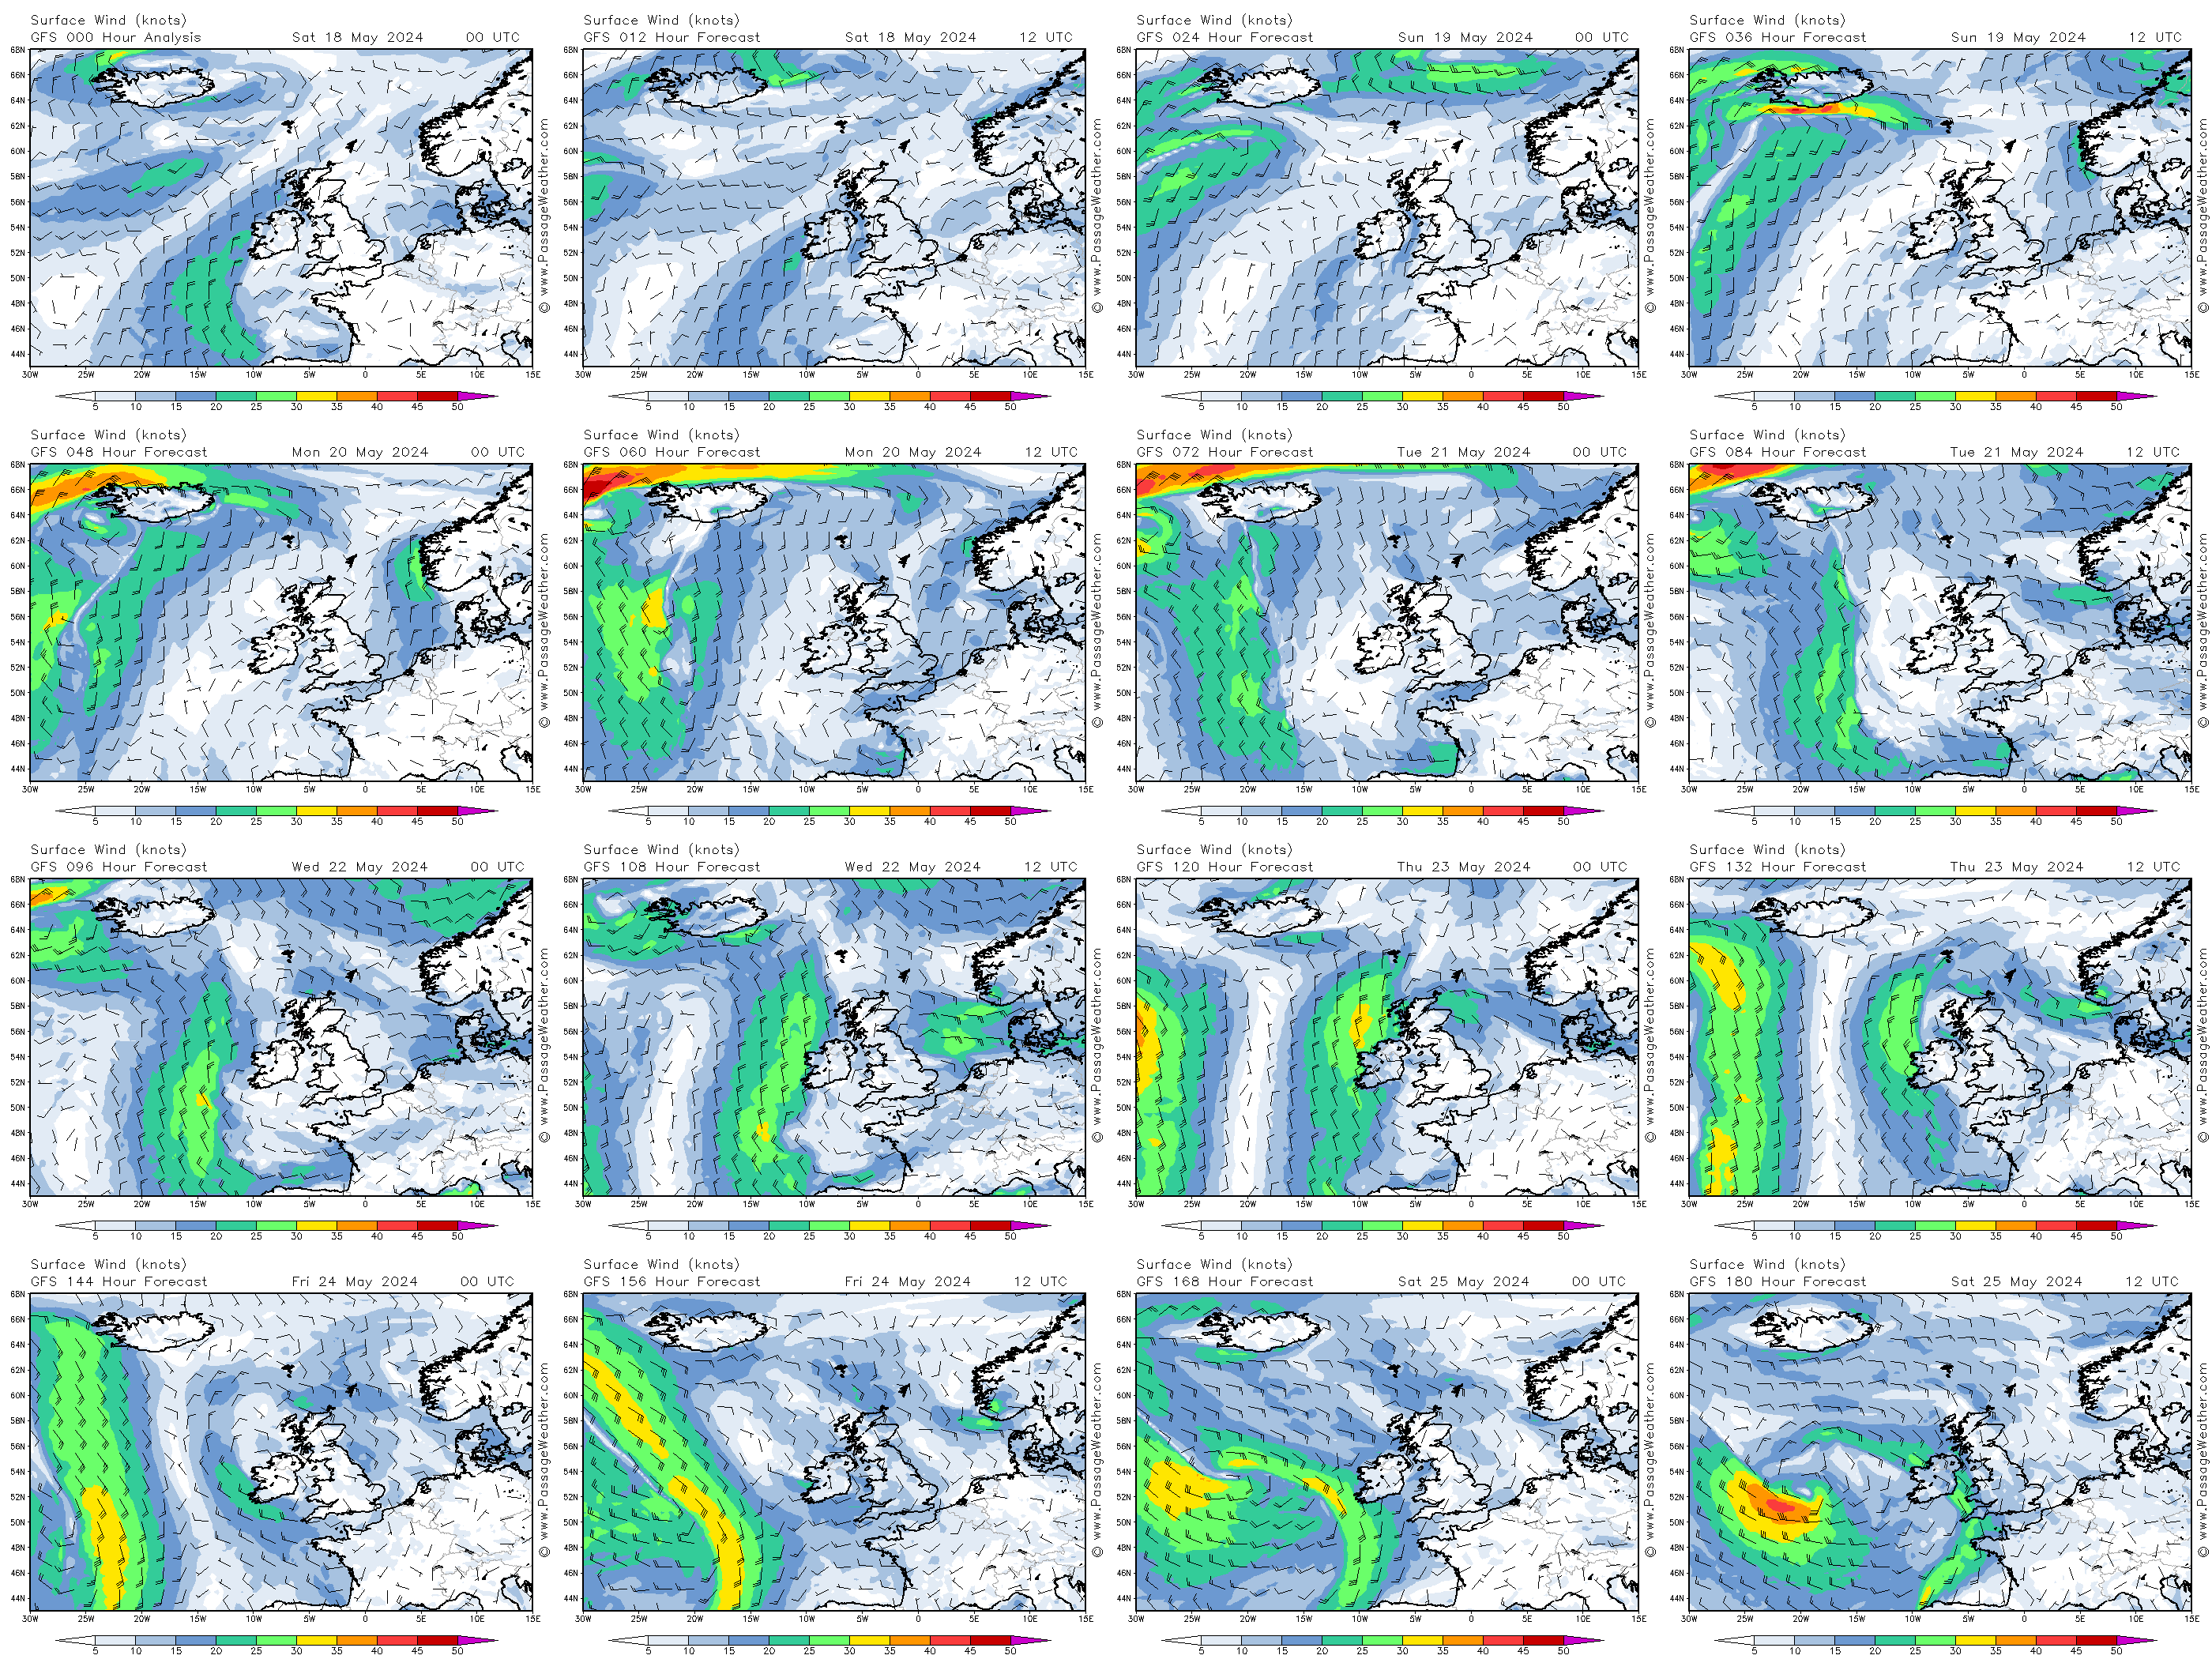
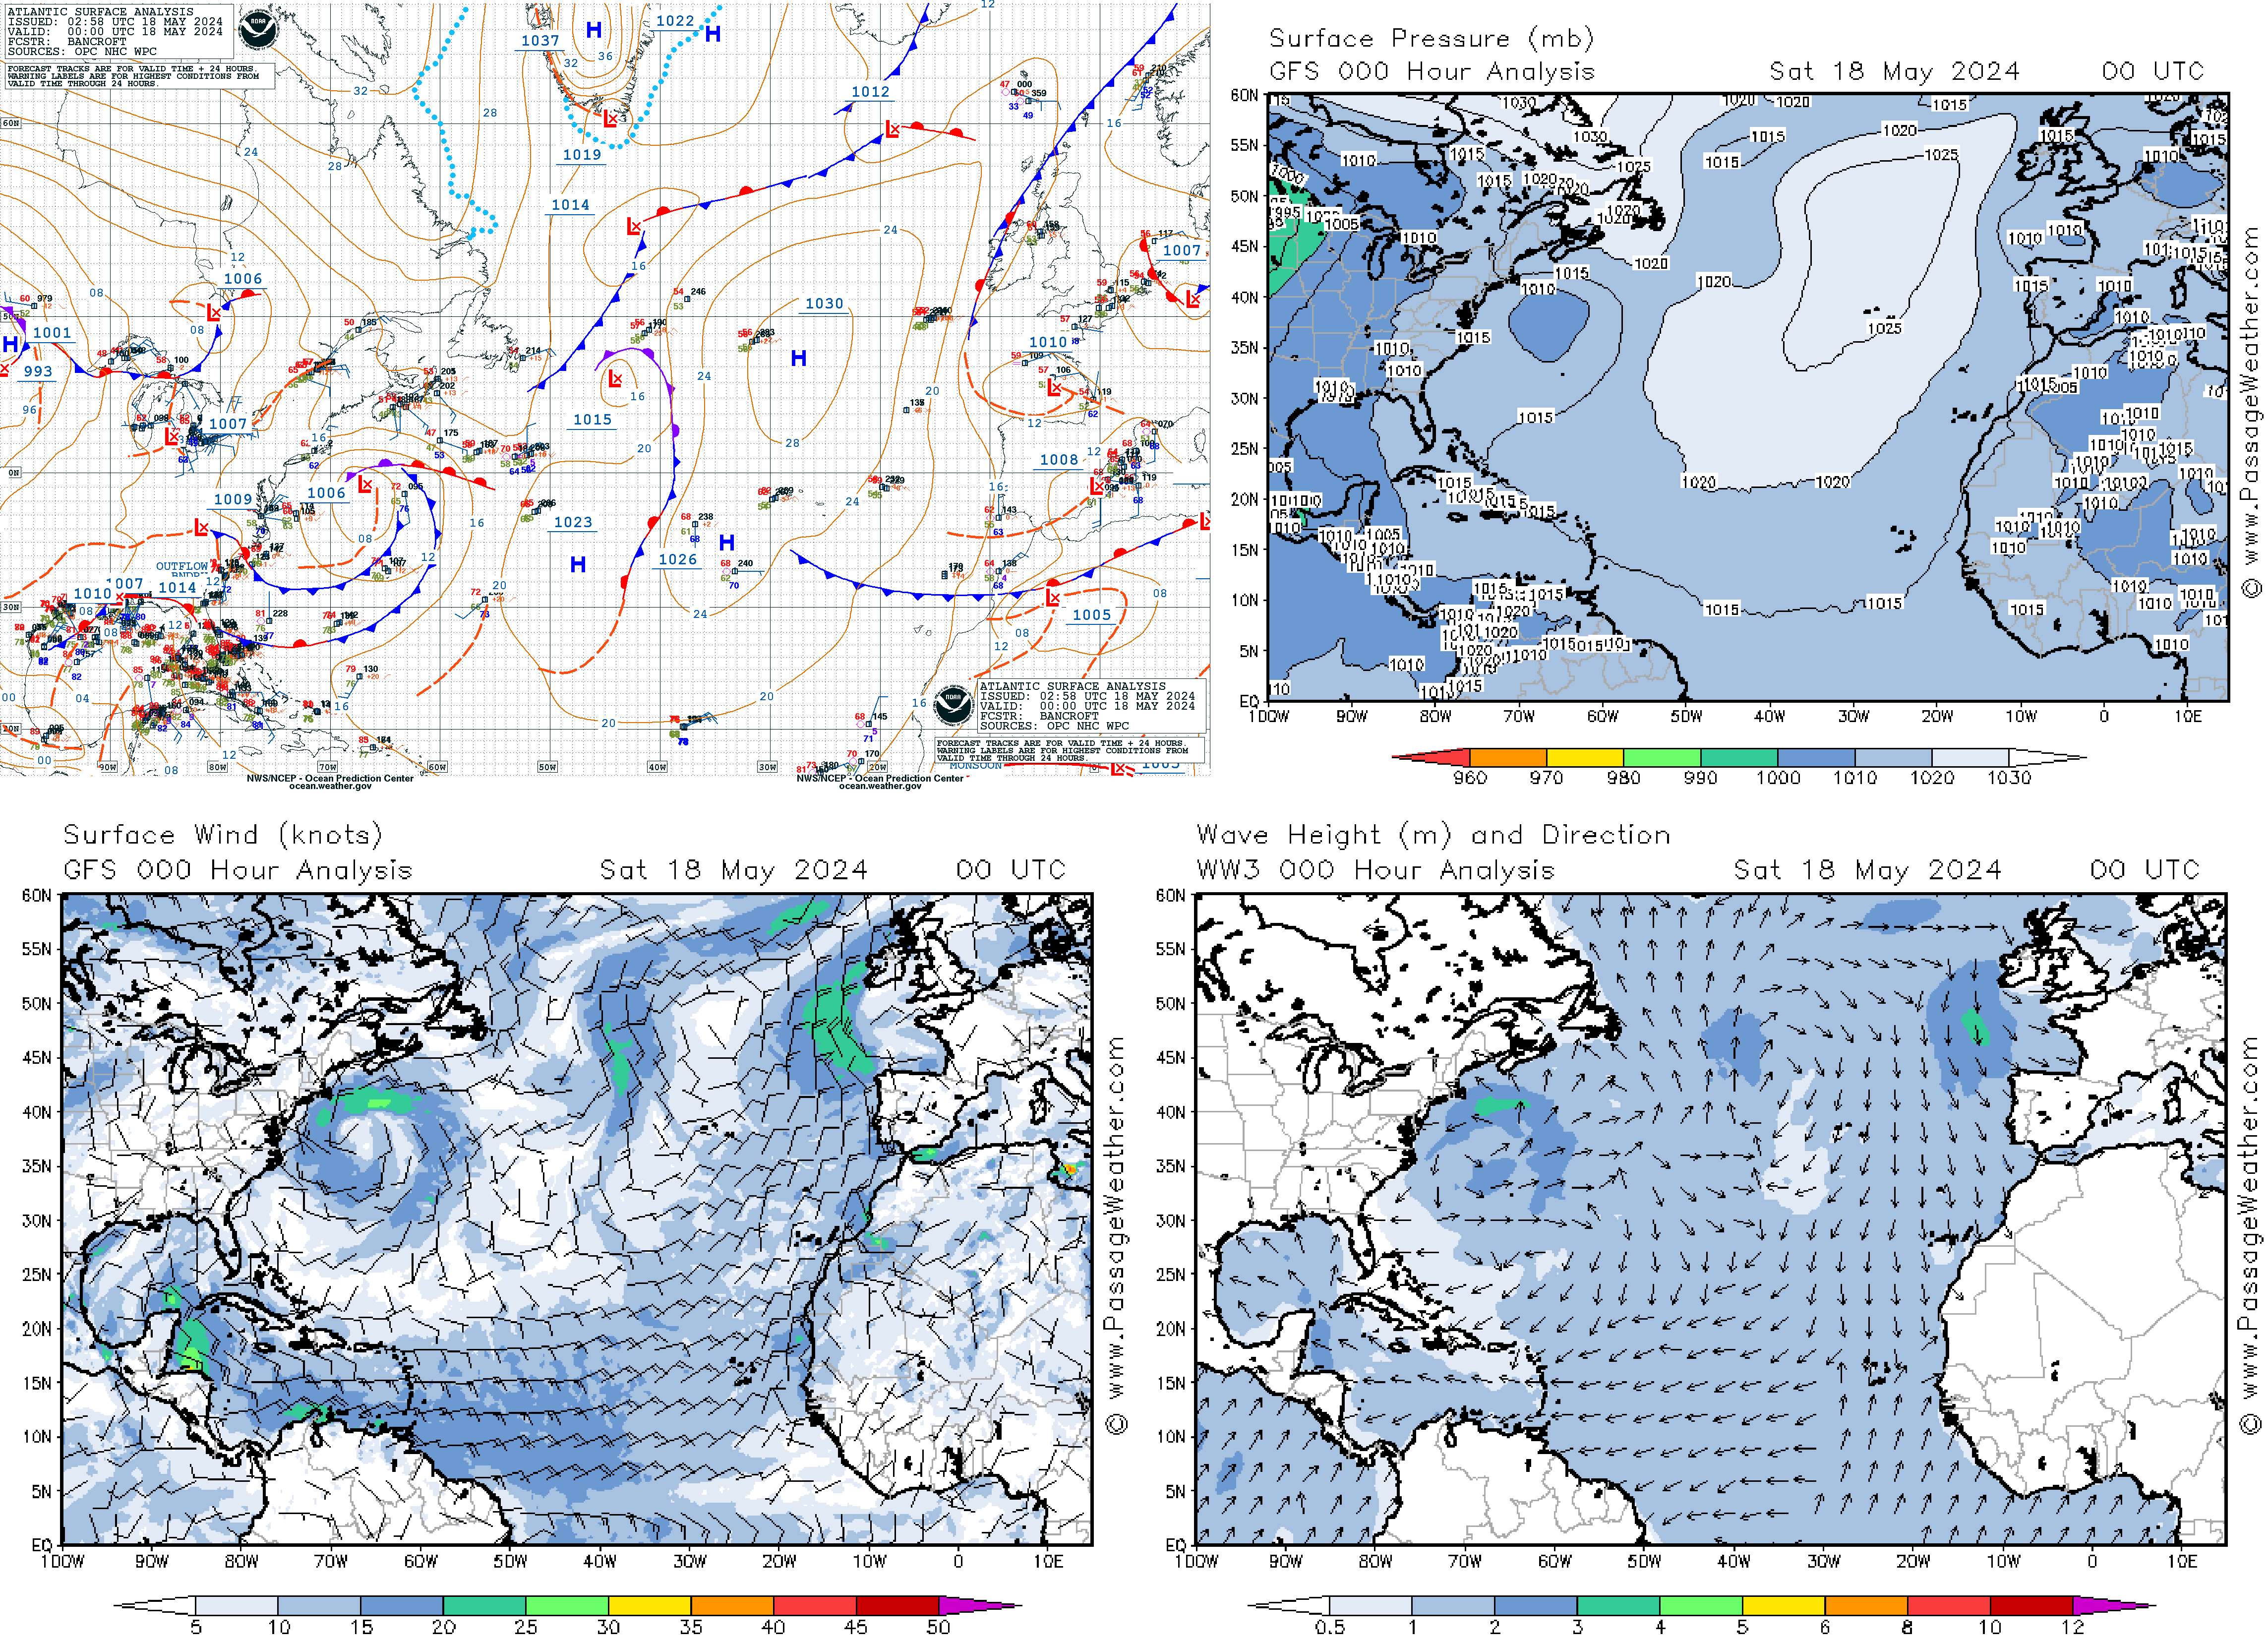
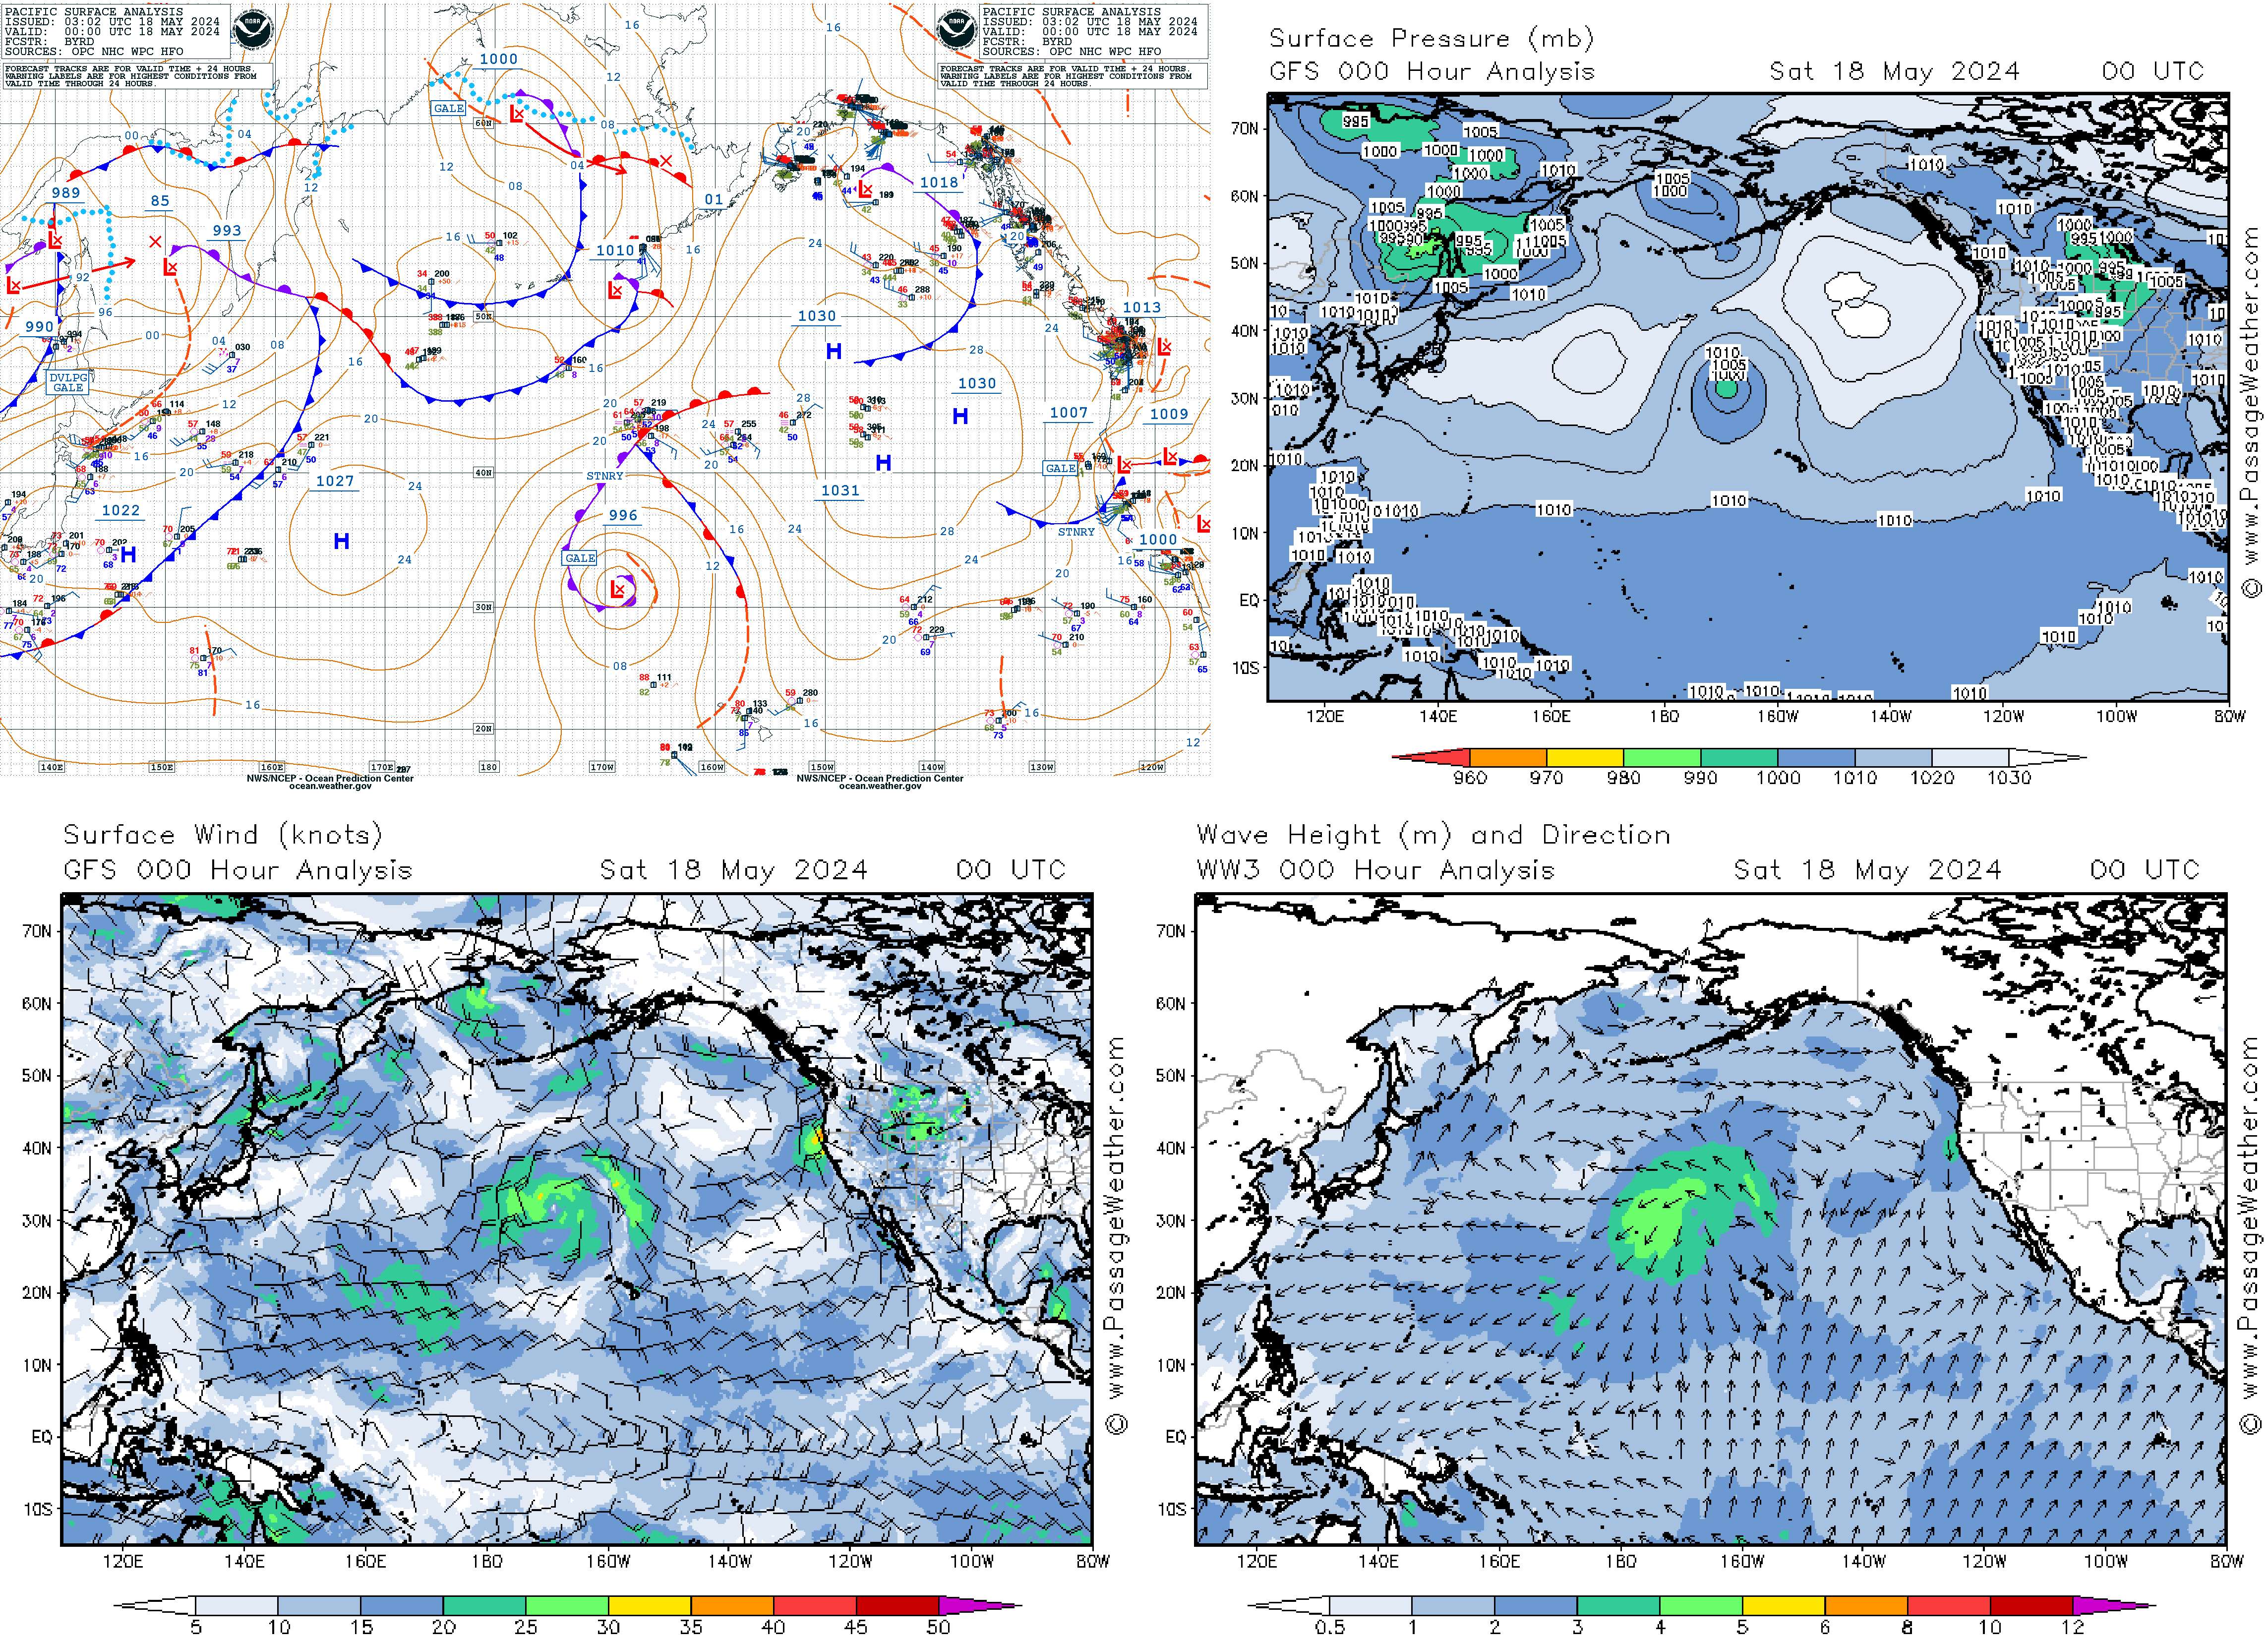
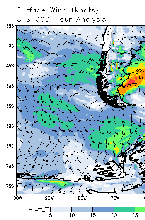
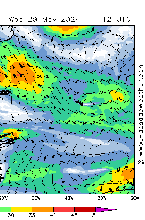
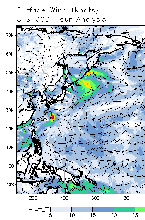
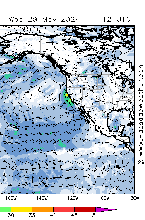
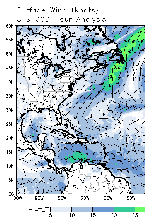
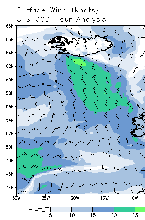
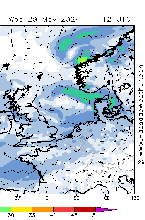
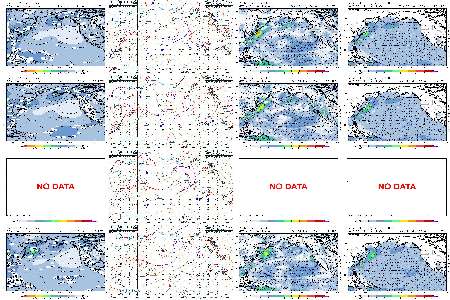
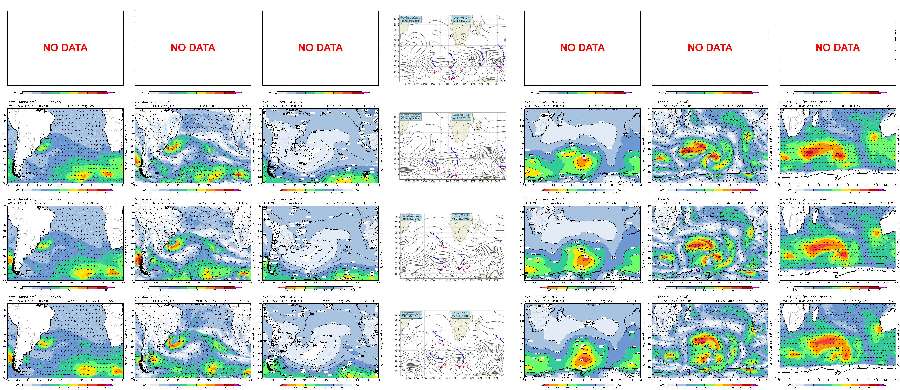
✔ What does the GRIB Analysis of Wind, Wave and MSLP show for sea areas worldwide ?
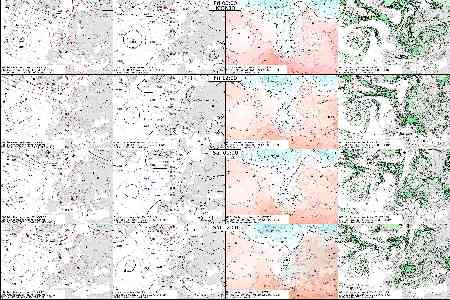
✔ FORECAST How are the GRIB Forecasts of Wind, Wave and MSLP until H+180?
✔ FORECAST How are the GRIB Forecasts with timesteps of 3 hours ?
✔ FORECAST Where are`Areas with severe weather - high seas, storm.
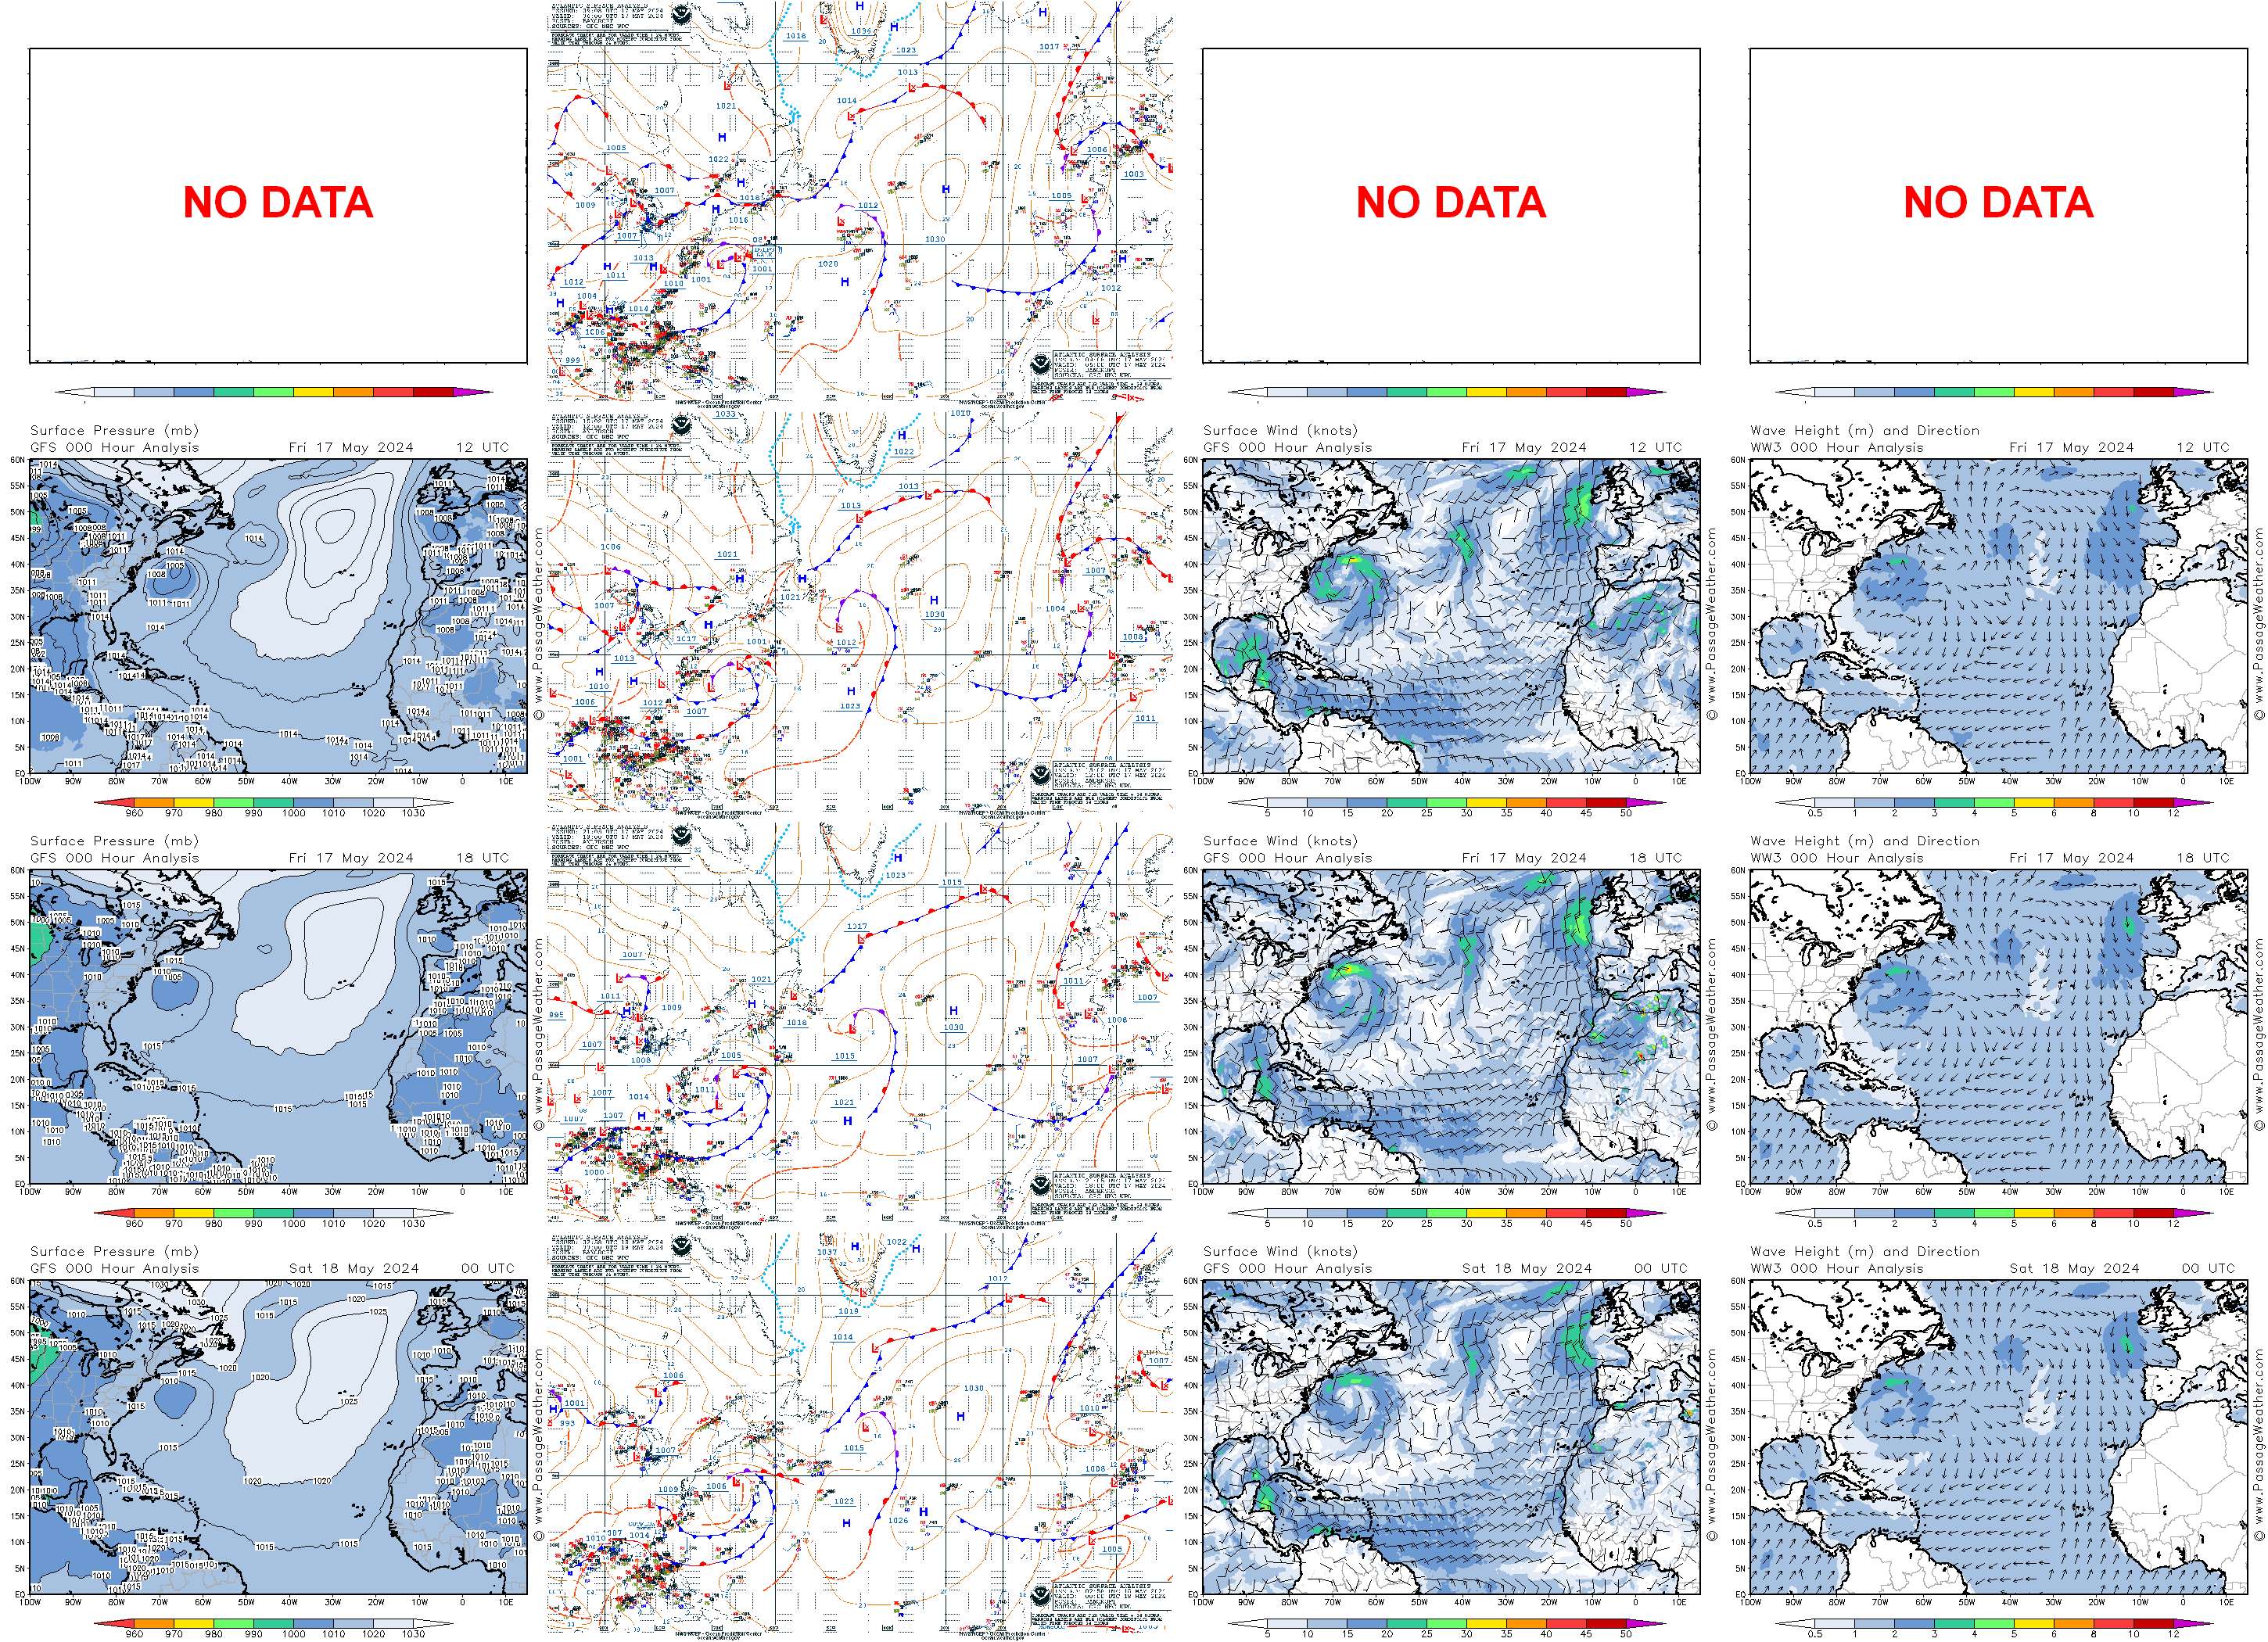
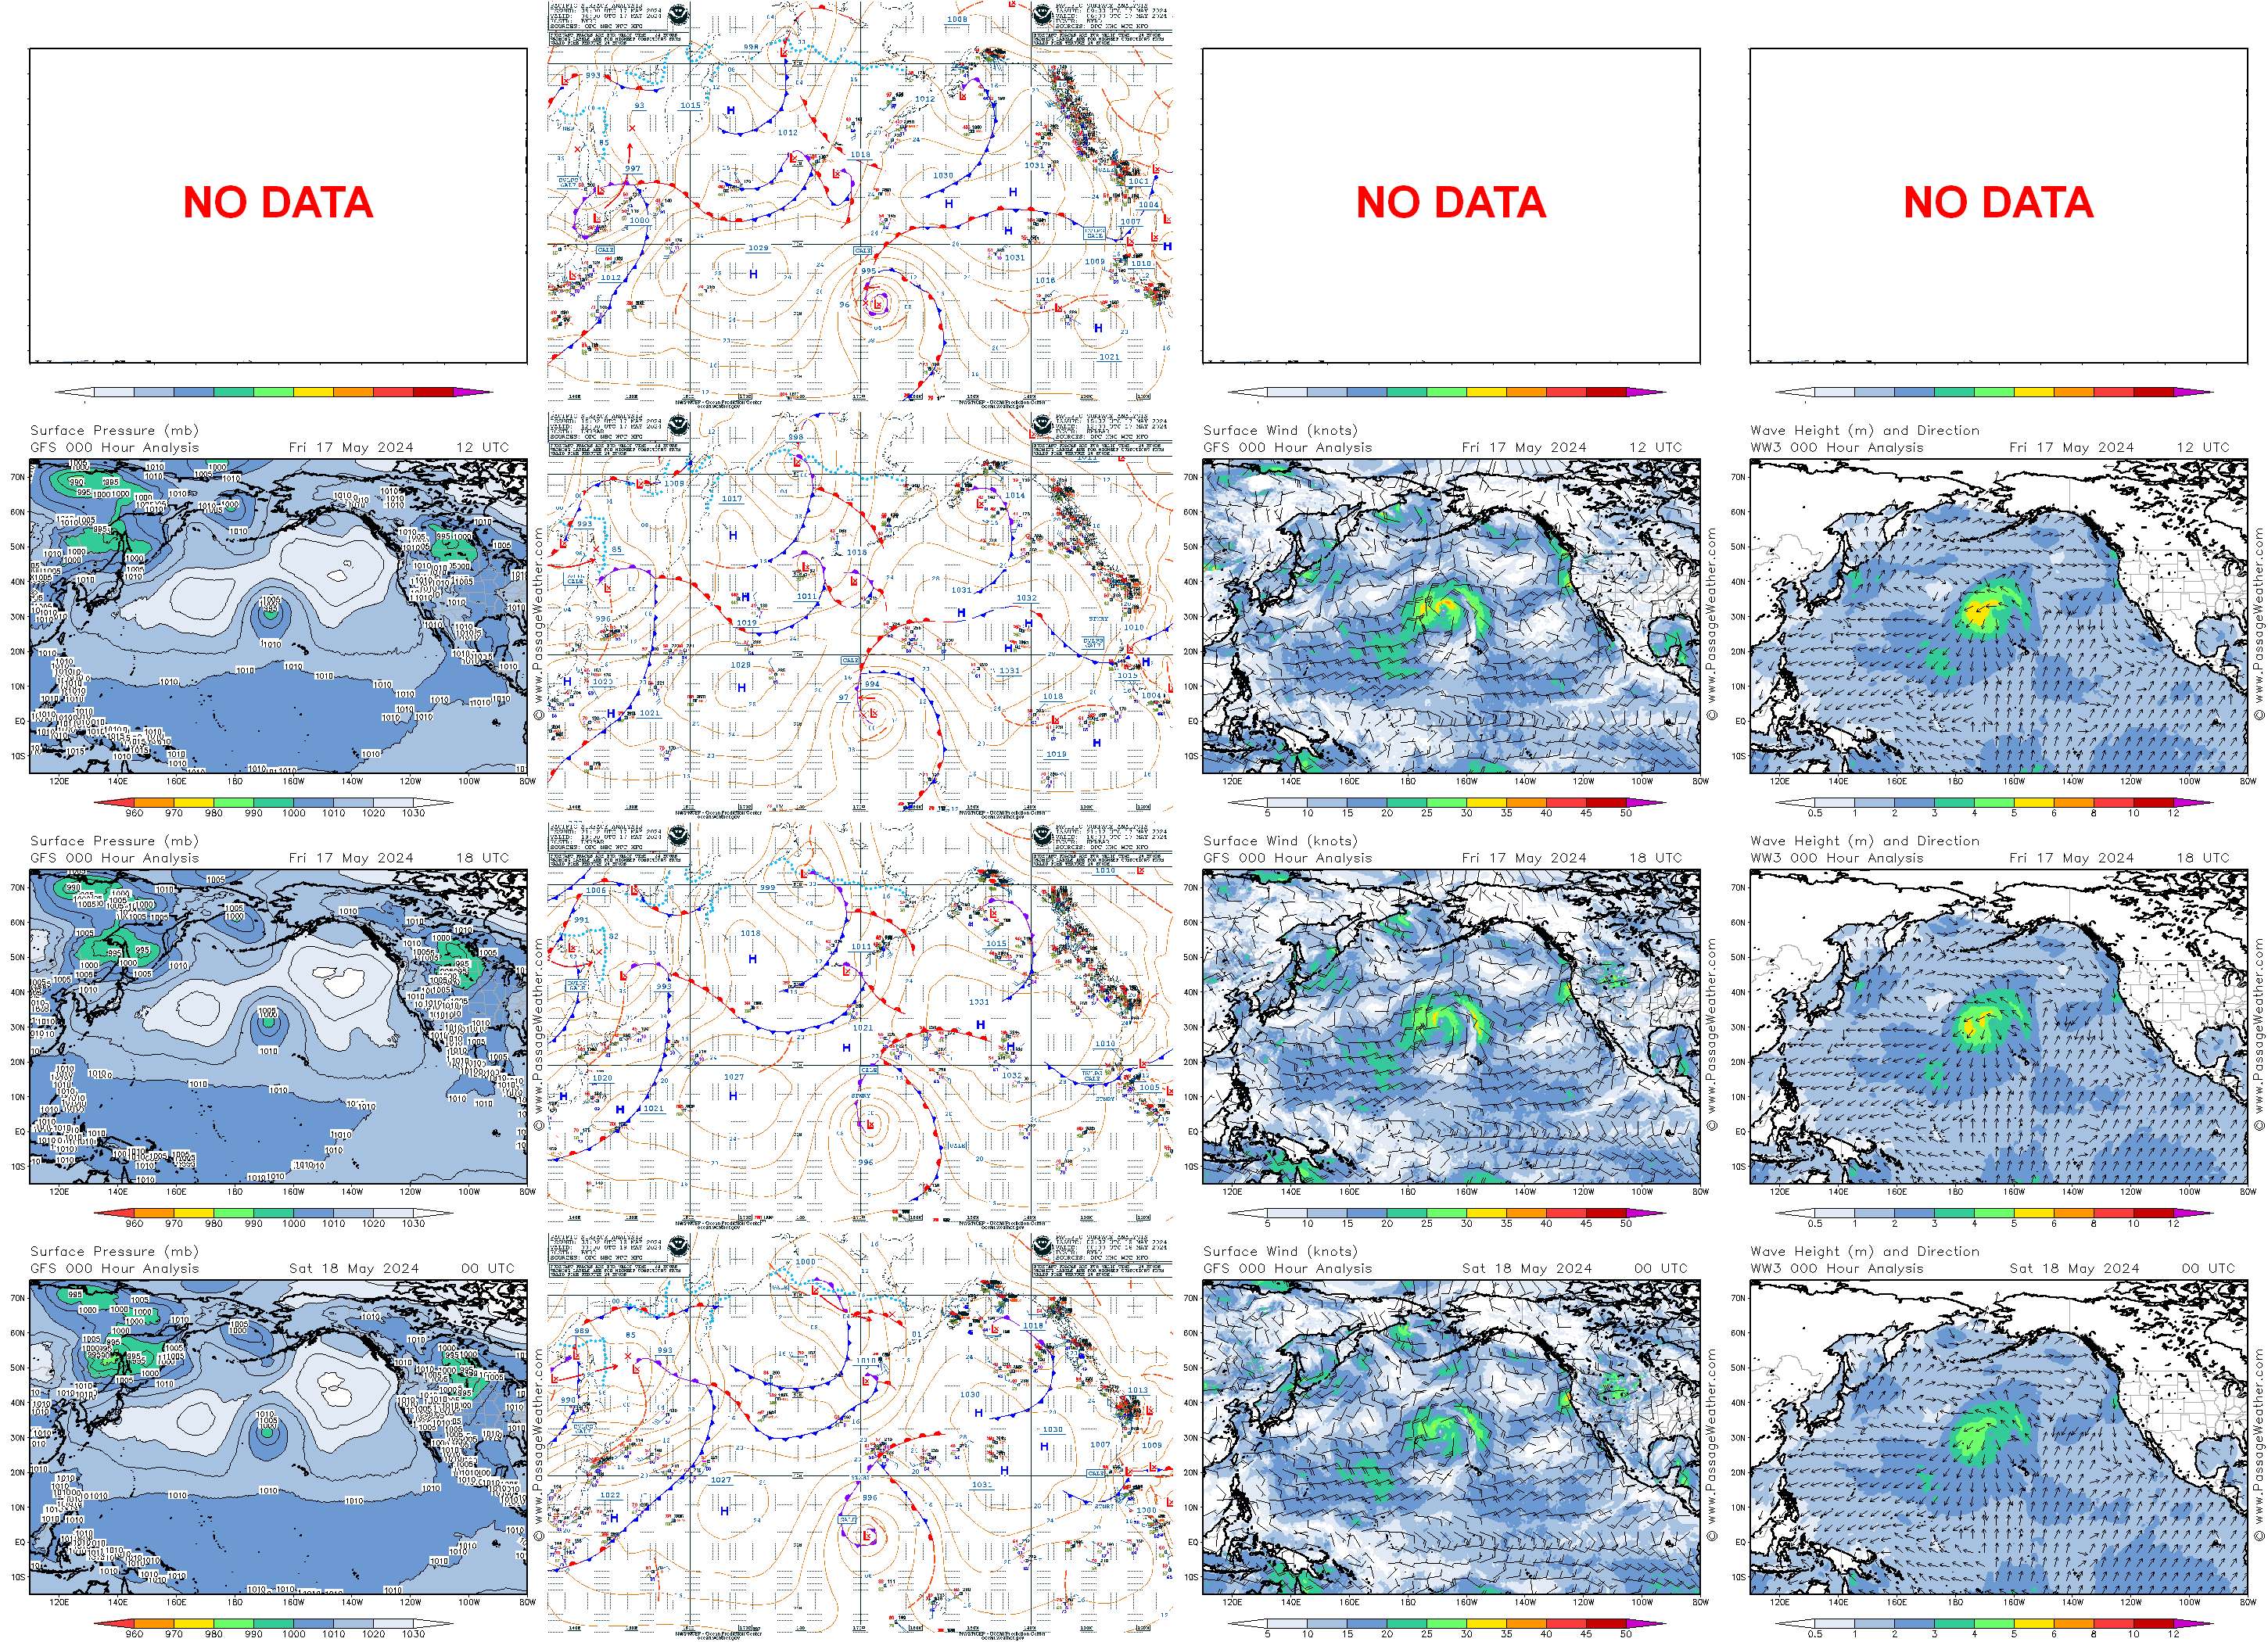
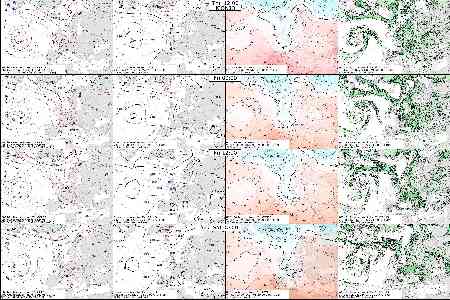
✔ HINDCAST How were the GRIB Forecasts for today with lead-times up to H-180 hours?
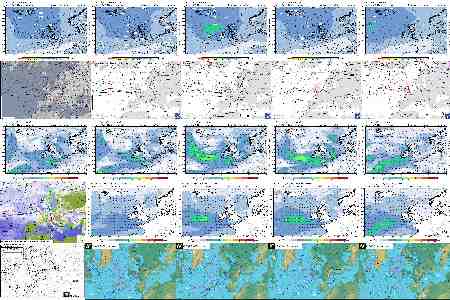
Perfect Forecasts show in the Hindcast-Array 16 identical ch�rts - all differences to the analysis
(under- bzw. overforecast) can be interpreted as forecast errors. This near-realtime forecast check
is continuously available: 365 times per year, twice per day, 00 UTC und 12 UTC.
The experience shows, that GFS-GRIB-Forecasts are of high quality.
The 24-48-72 hrs forecast are mostly identical to the analysis,
also in cases of severe weather and heavy storms. With these
leadtime, observed and not forecast are rare events. There is,
however, an almost typical feature: slight, sometimes significant
overforecast for lead-times around five days.
The HINDCAST-Arrays of the past week for all areas worldwide
in the archive show this forecast quality.
GRIB is very popular for marine-meteorological applications of wind and sea forecasts
because they are easy to handle: Radio data communication (small areas of ship's vicinity
can easily be defined and direct values for wind and sea are given.
The interpretation is not trivial - the easy way: Take data as given - they are of binary
character: right or wrong. This is not very satisfying.
For the interpretation of GRIB forecasts, a synoptic background is very helpful to allow
a synoptic interpretation and anticipating possible synoptic variations of the GRIB data given.
Moreover the knowledge of the climatological situation and orographic influence makes it
easier to judge whether or not the situation is typical for the season, h�w stable is the
synoptic situation and which specific features do I have to expect in my area.
Helpful for this complex interpreation of GRIB data is the simultaneous presentation oRIB and
classical forecasts. It allows to get experience in synoptic interpretation of GRIB forecasts
if the latter are available only.
Nore 1: 'Visual verification' in terms of: Personal comparison of two products .
Nore 2: 'Classical' in terms of: Manual (or semi-/automatic) analysis, On-Screen-Analysis,
with frontal systems, NOT the automatic DMO isolines-only Analysis of GRIB-fields of MSL pressure
without fronts.
Abbreviations:
AUS BoM Bureau of Meteorology
NLD KNMI NMS Netherlands
USA NWS National Weather Serv
USA OPC Ocean Prediction Center
ZAF SAWS S-African Weather Serv
ENG UKMO UK MET Office
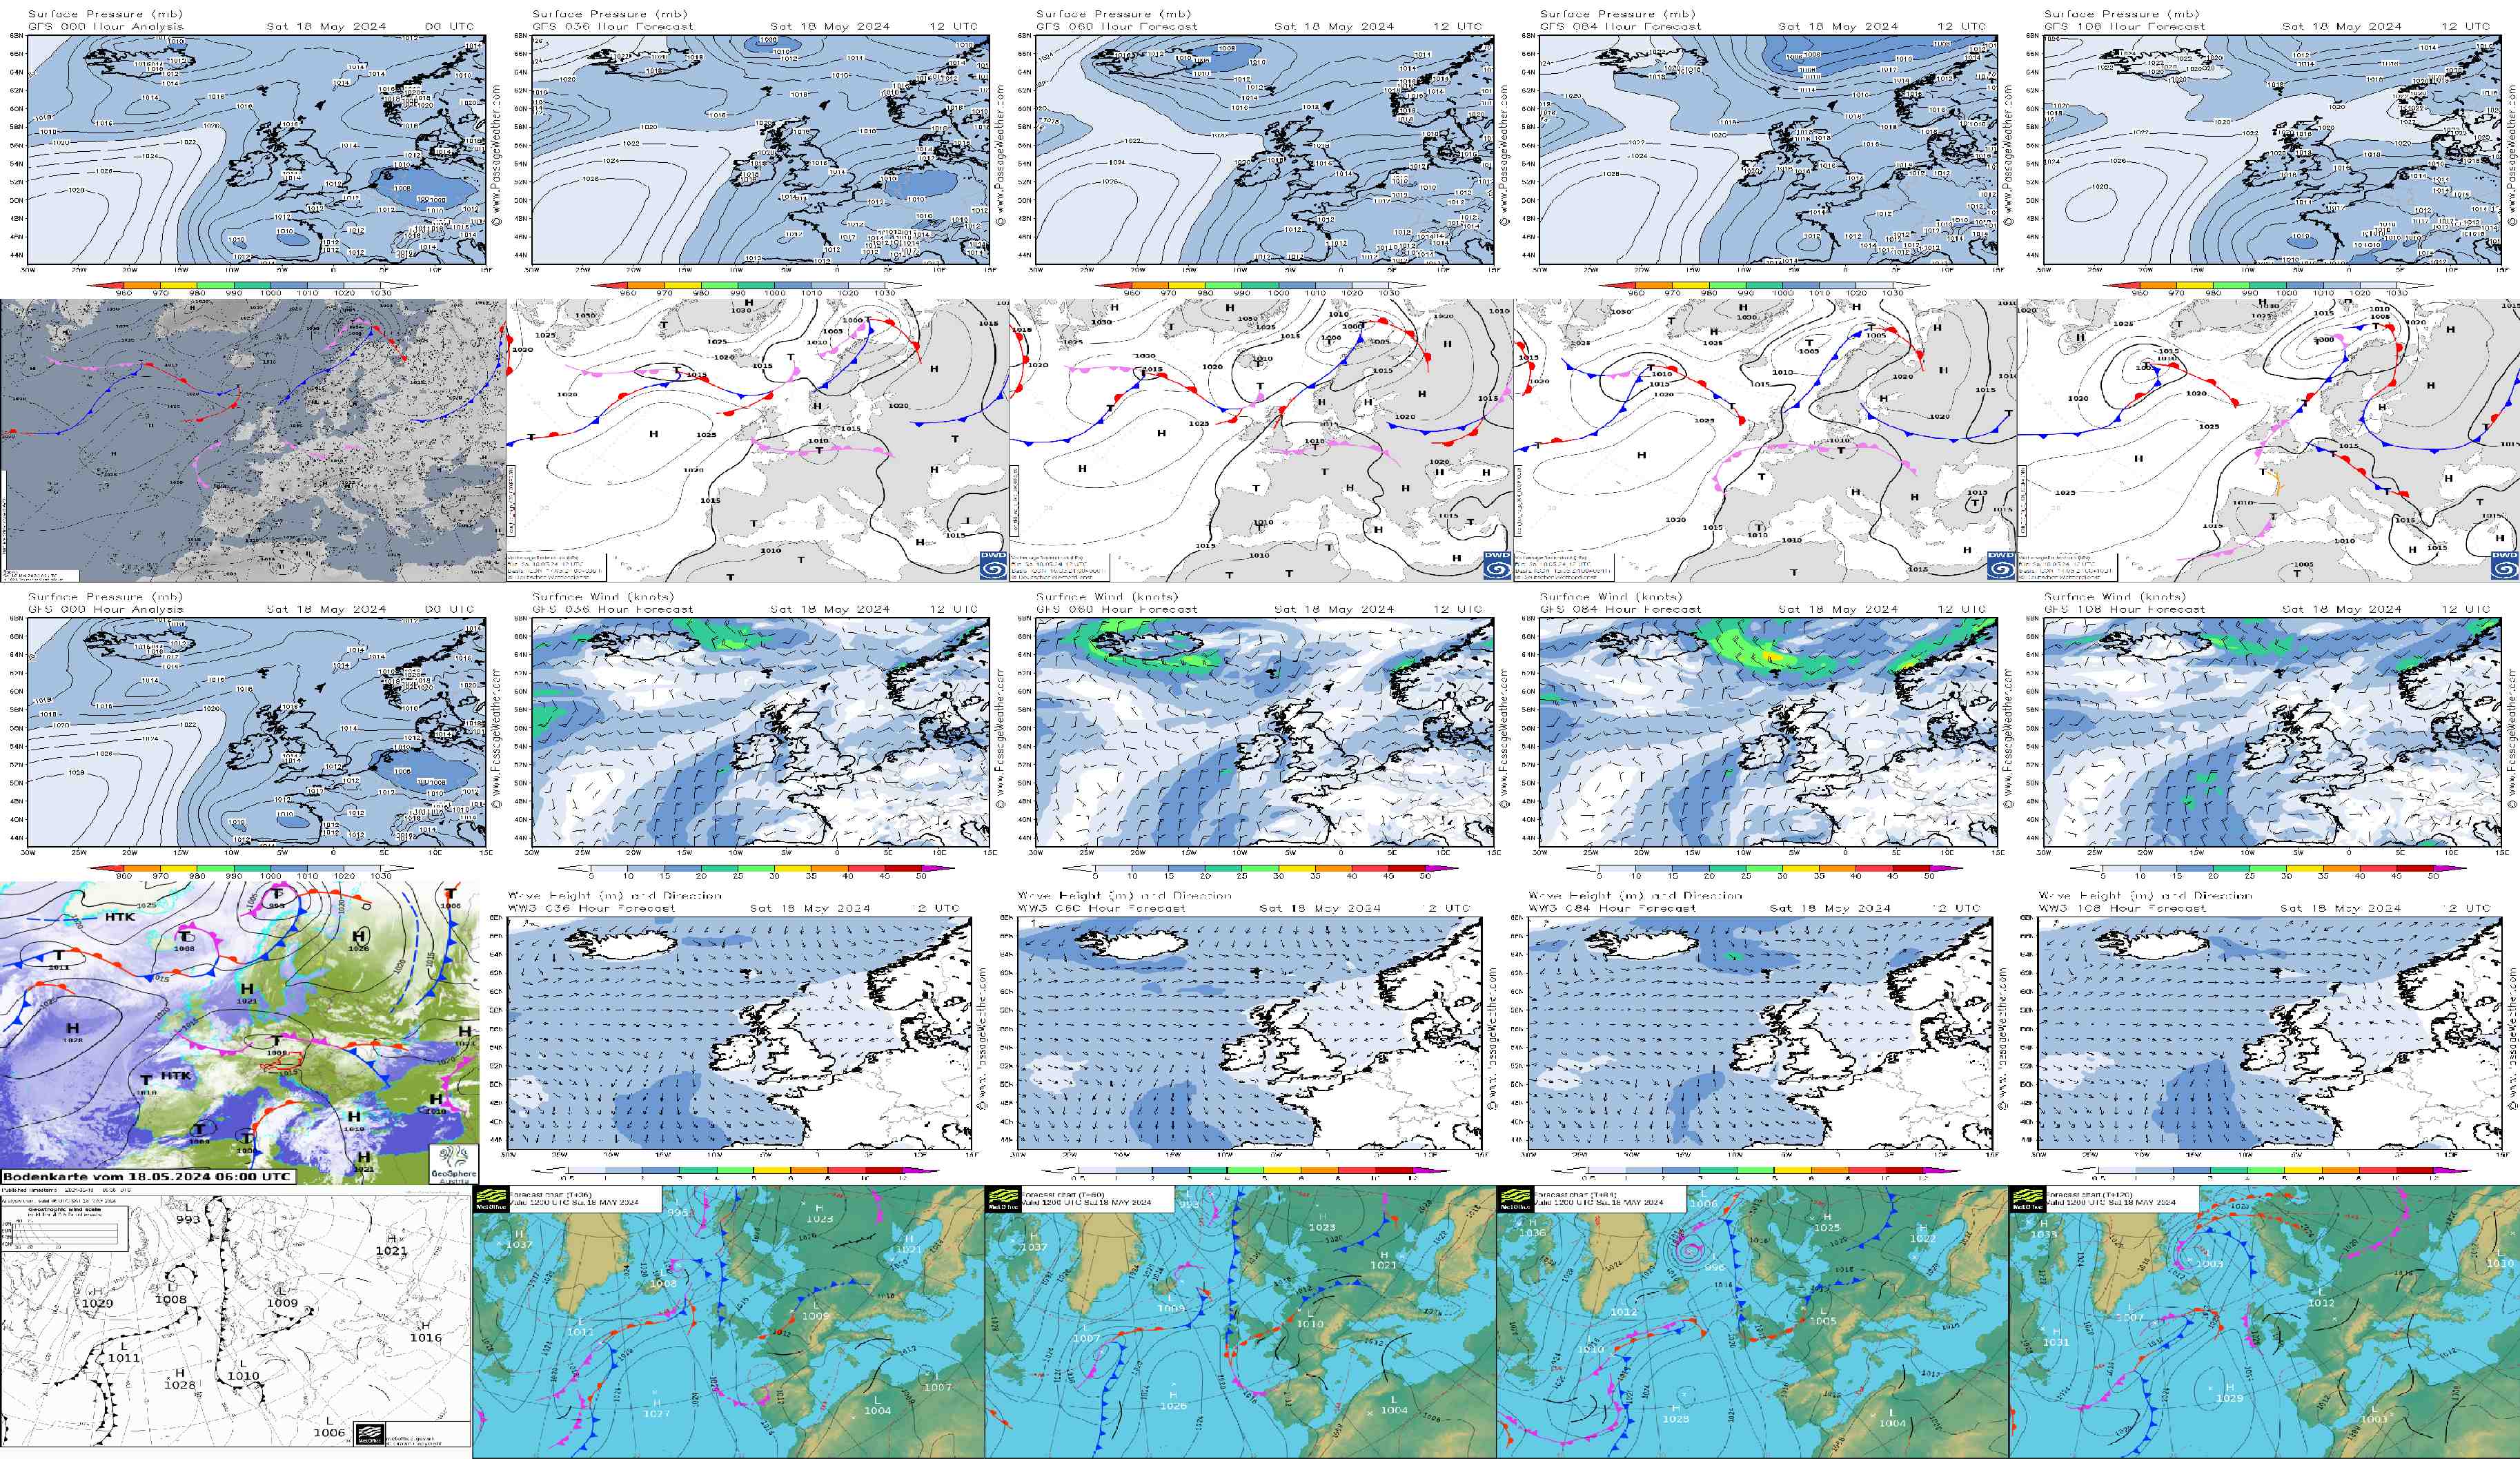
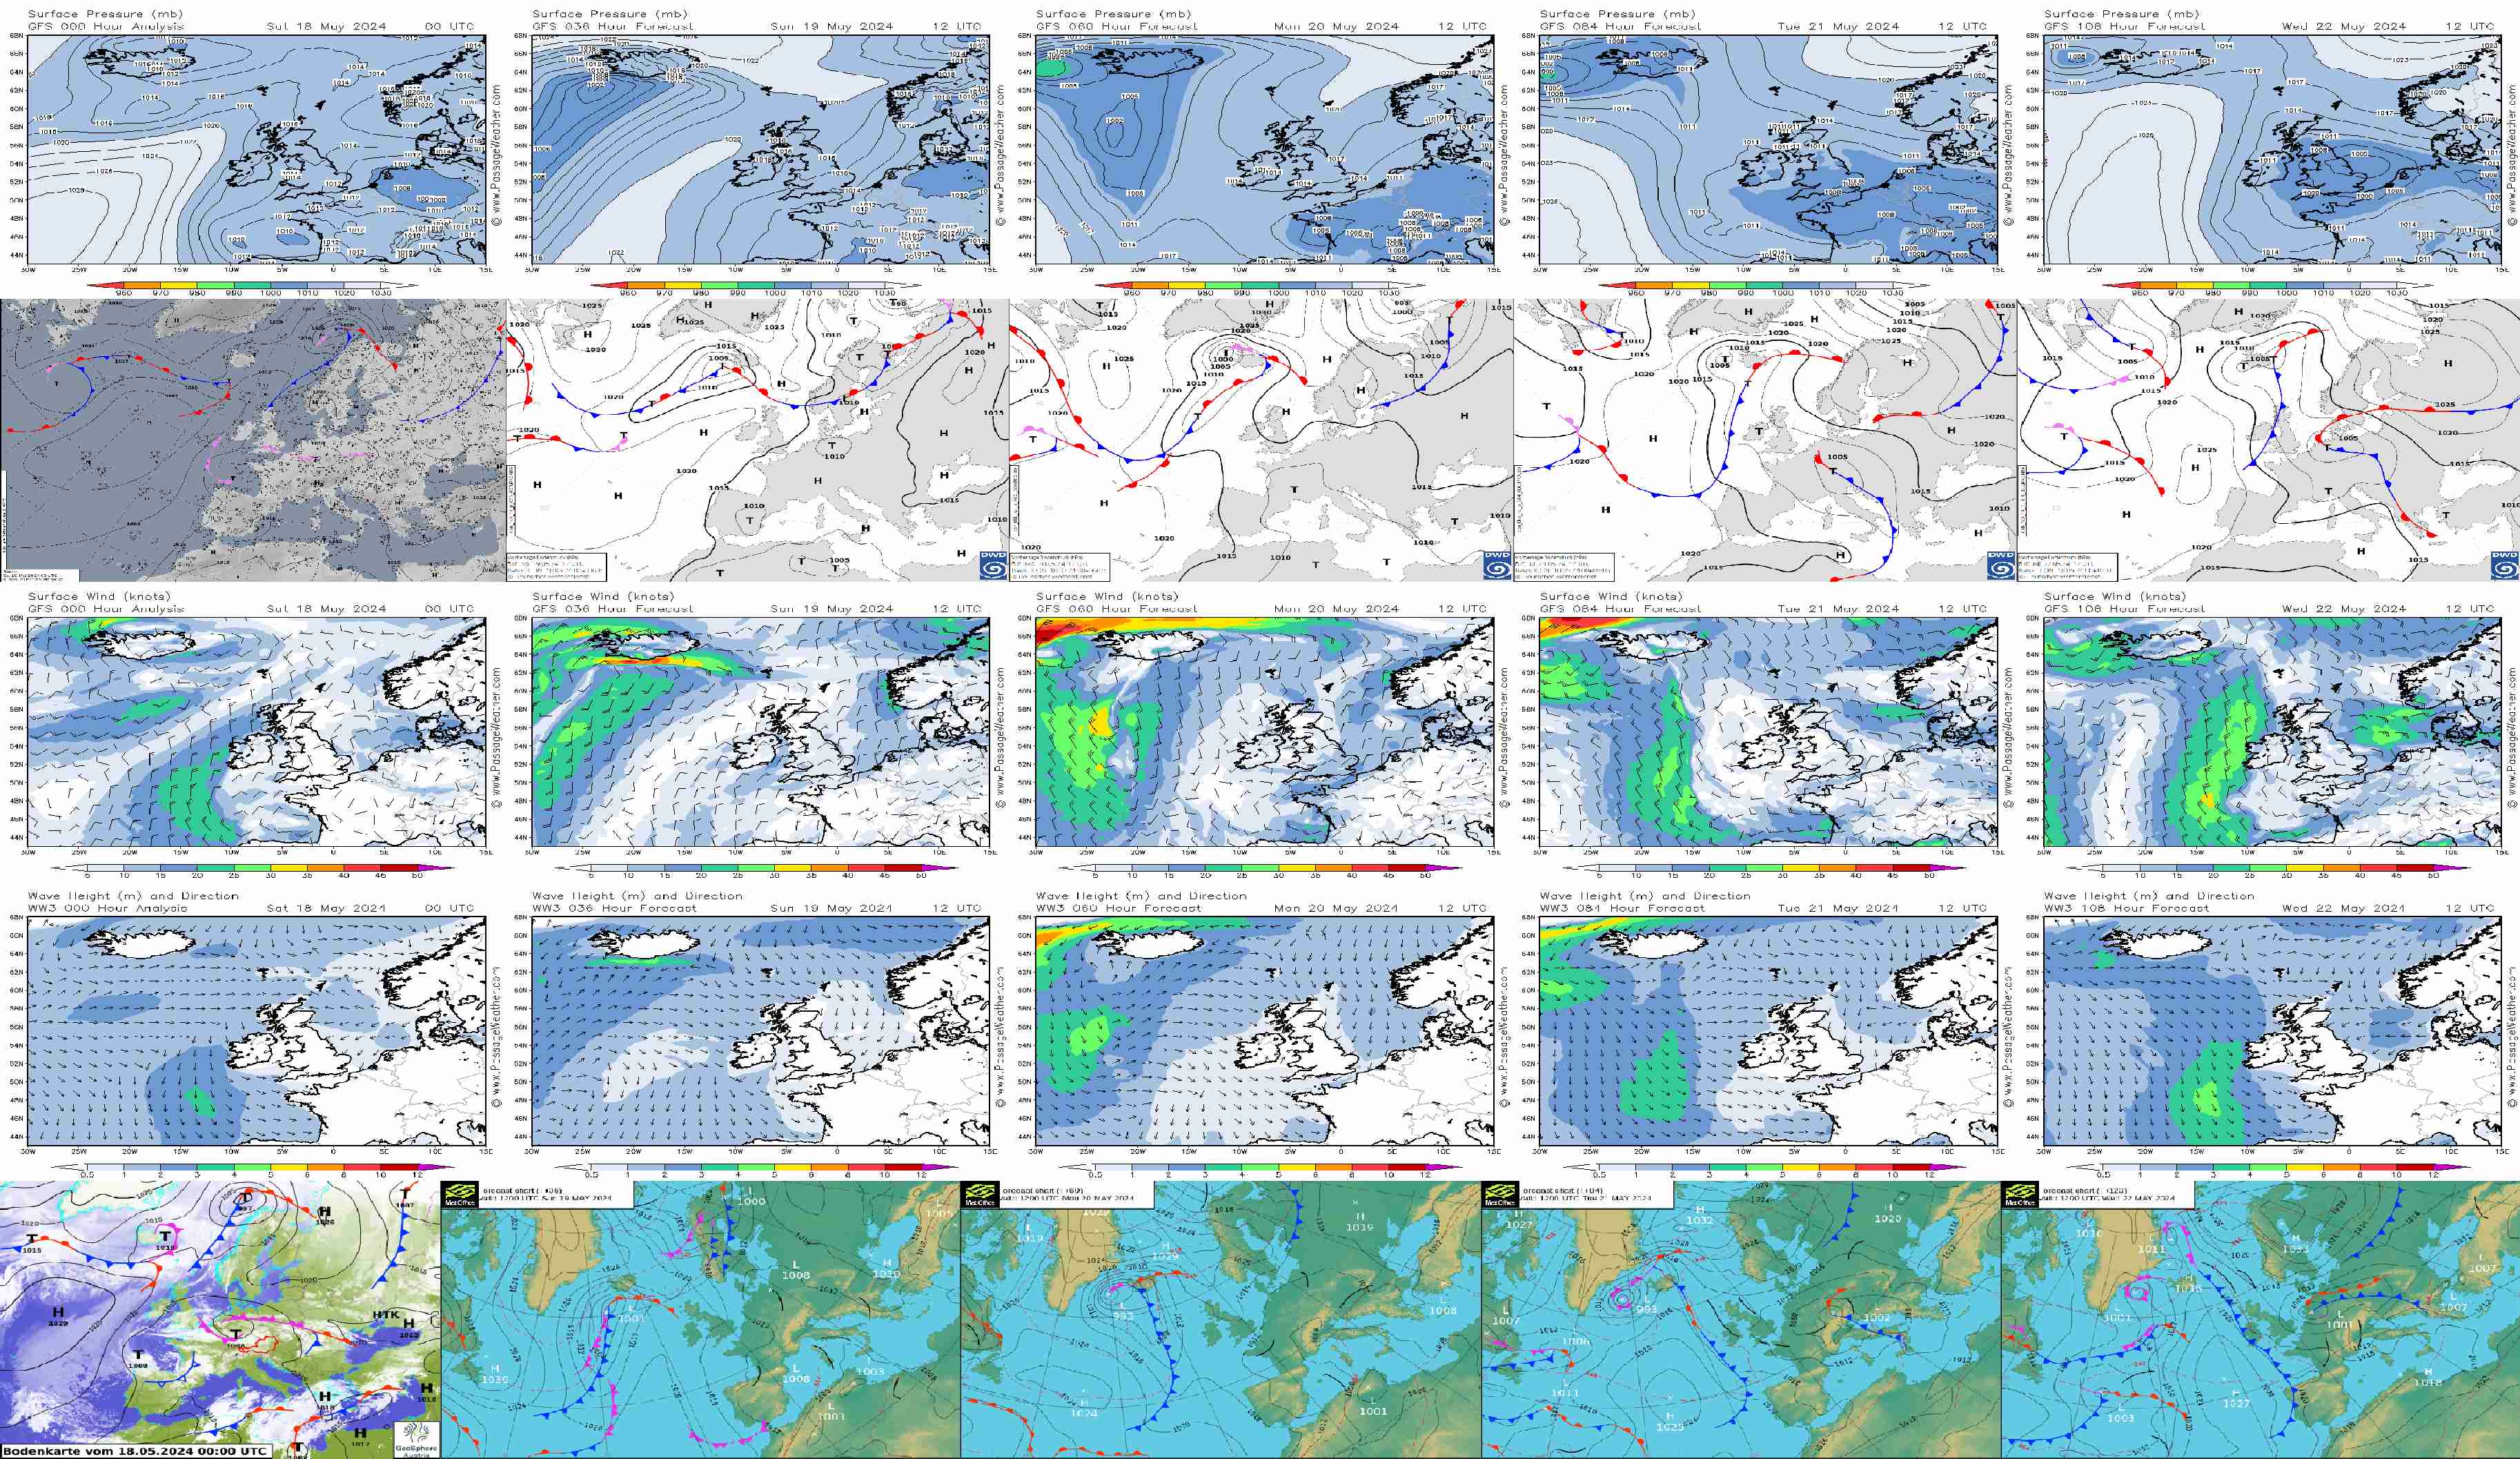
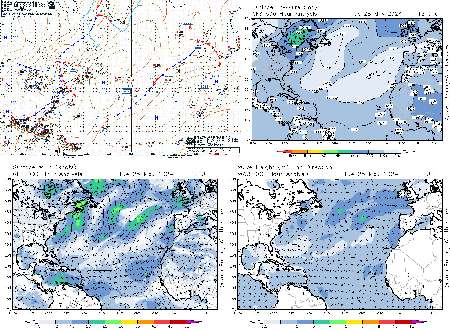
 FORECAST GRIB vs CLASSIC
✔ Comparison GRIB vs CLASSIC
✔ Classical-Synoptic GRIB-Interpretation
 Analysis GRIB vs CLASSIC
 GRIB vs Classic at VALID TIME
North Atlantic North Pacific
MSLP Analysis
NAT/EUR
N-Pacific
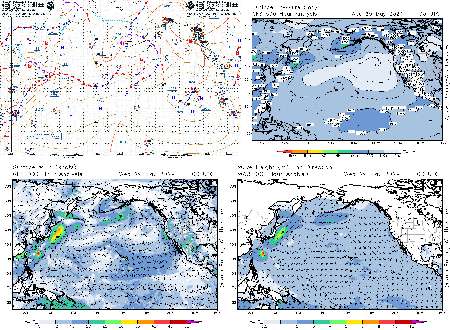
 GRIB vs Classic 00/06/12/18Z
North Pacific North Atlantic
MSLP Analysis
NAT/EUR
N-Pacific
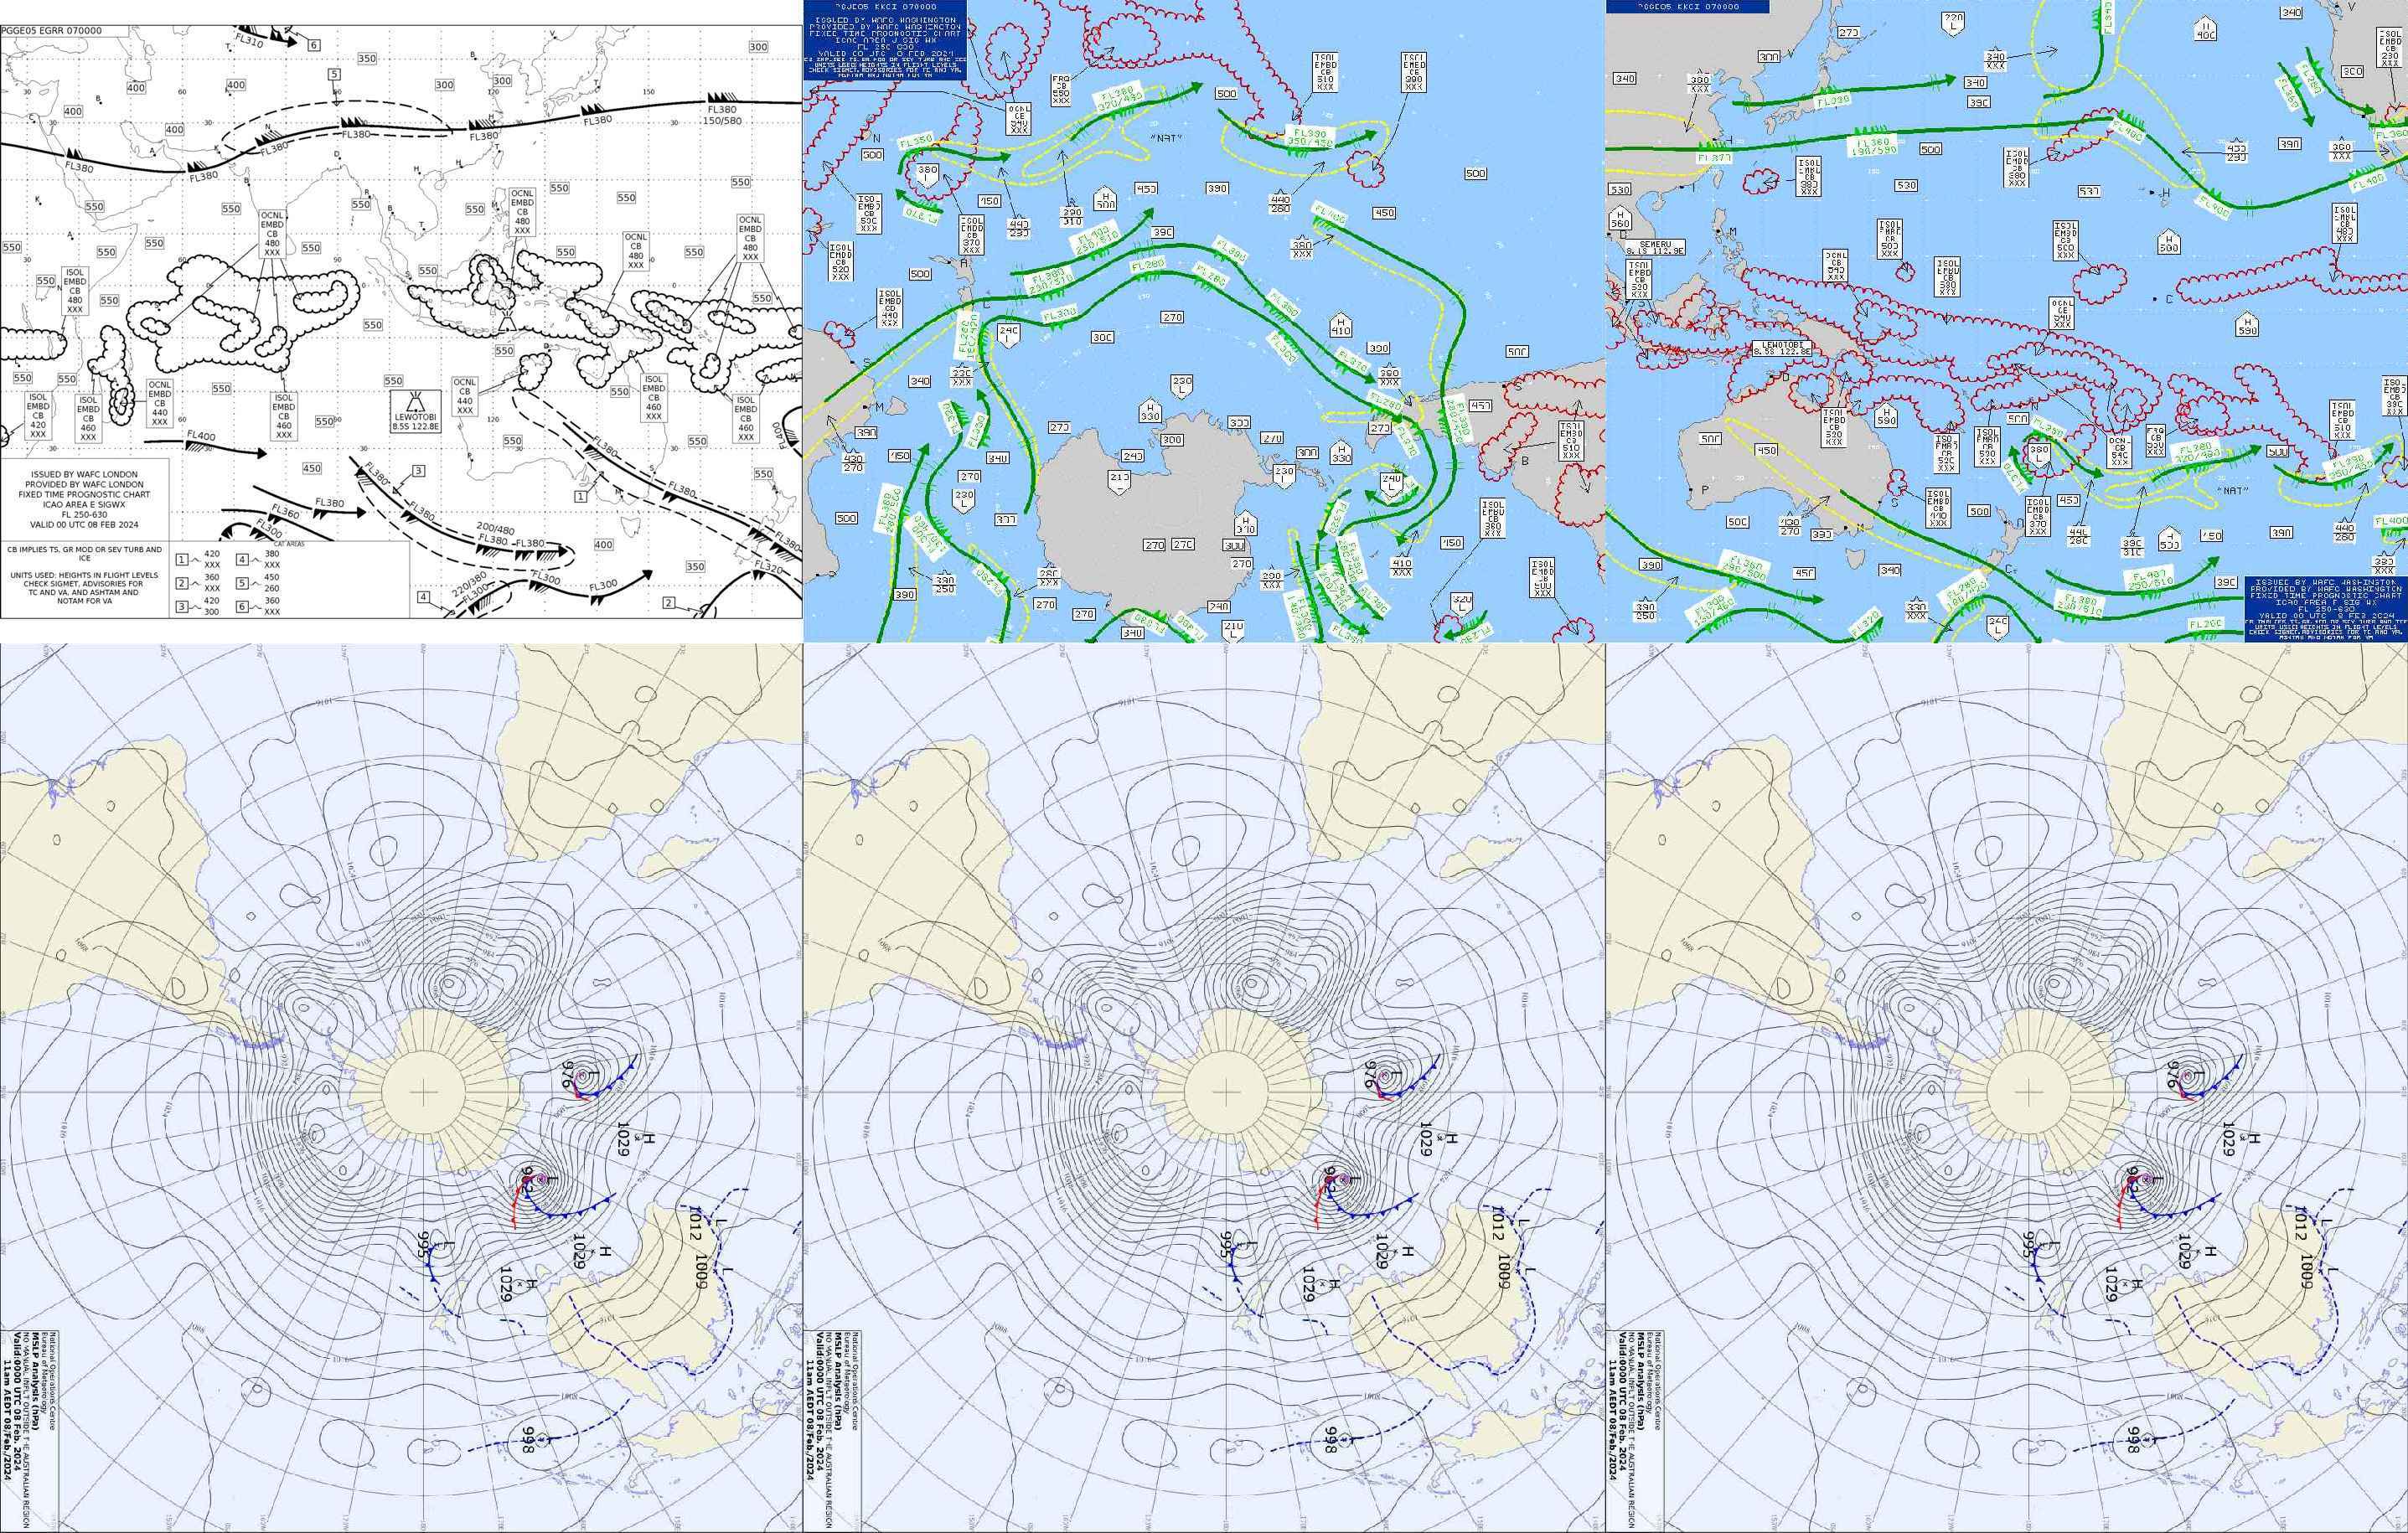
SÜD-Atlantic / SÜD-INDIK
MSLP Analysis
Süd-Afrika
✔ Synoptic Interpretation GRIB
✔ GRIB vs classical Analysis Wind/Sea/MSLP
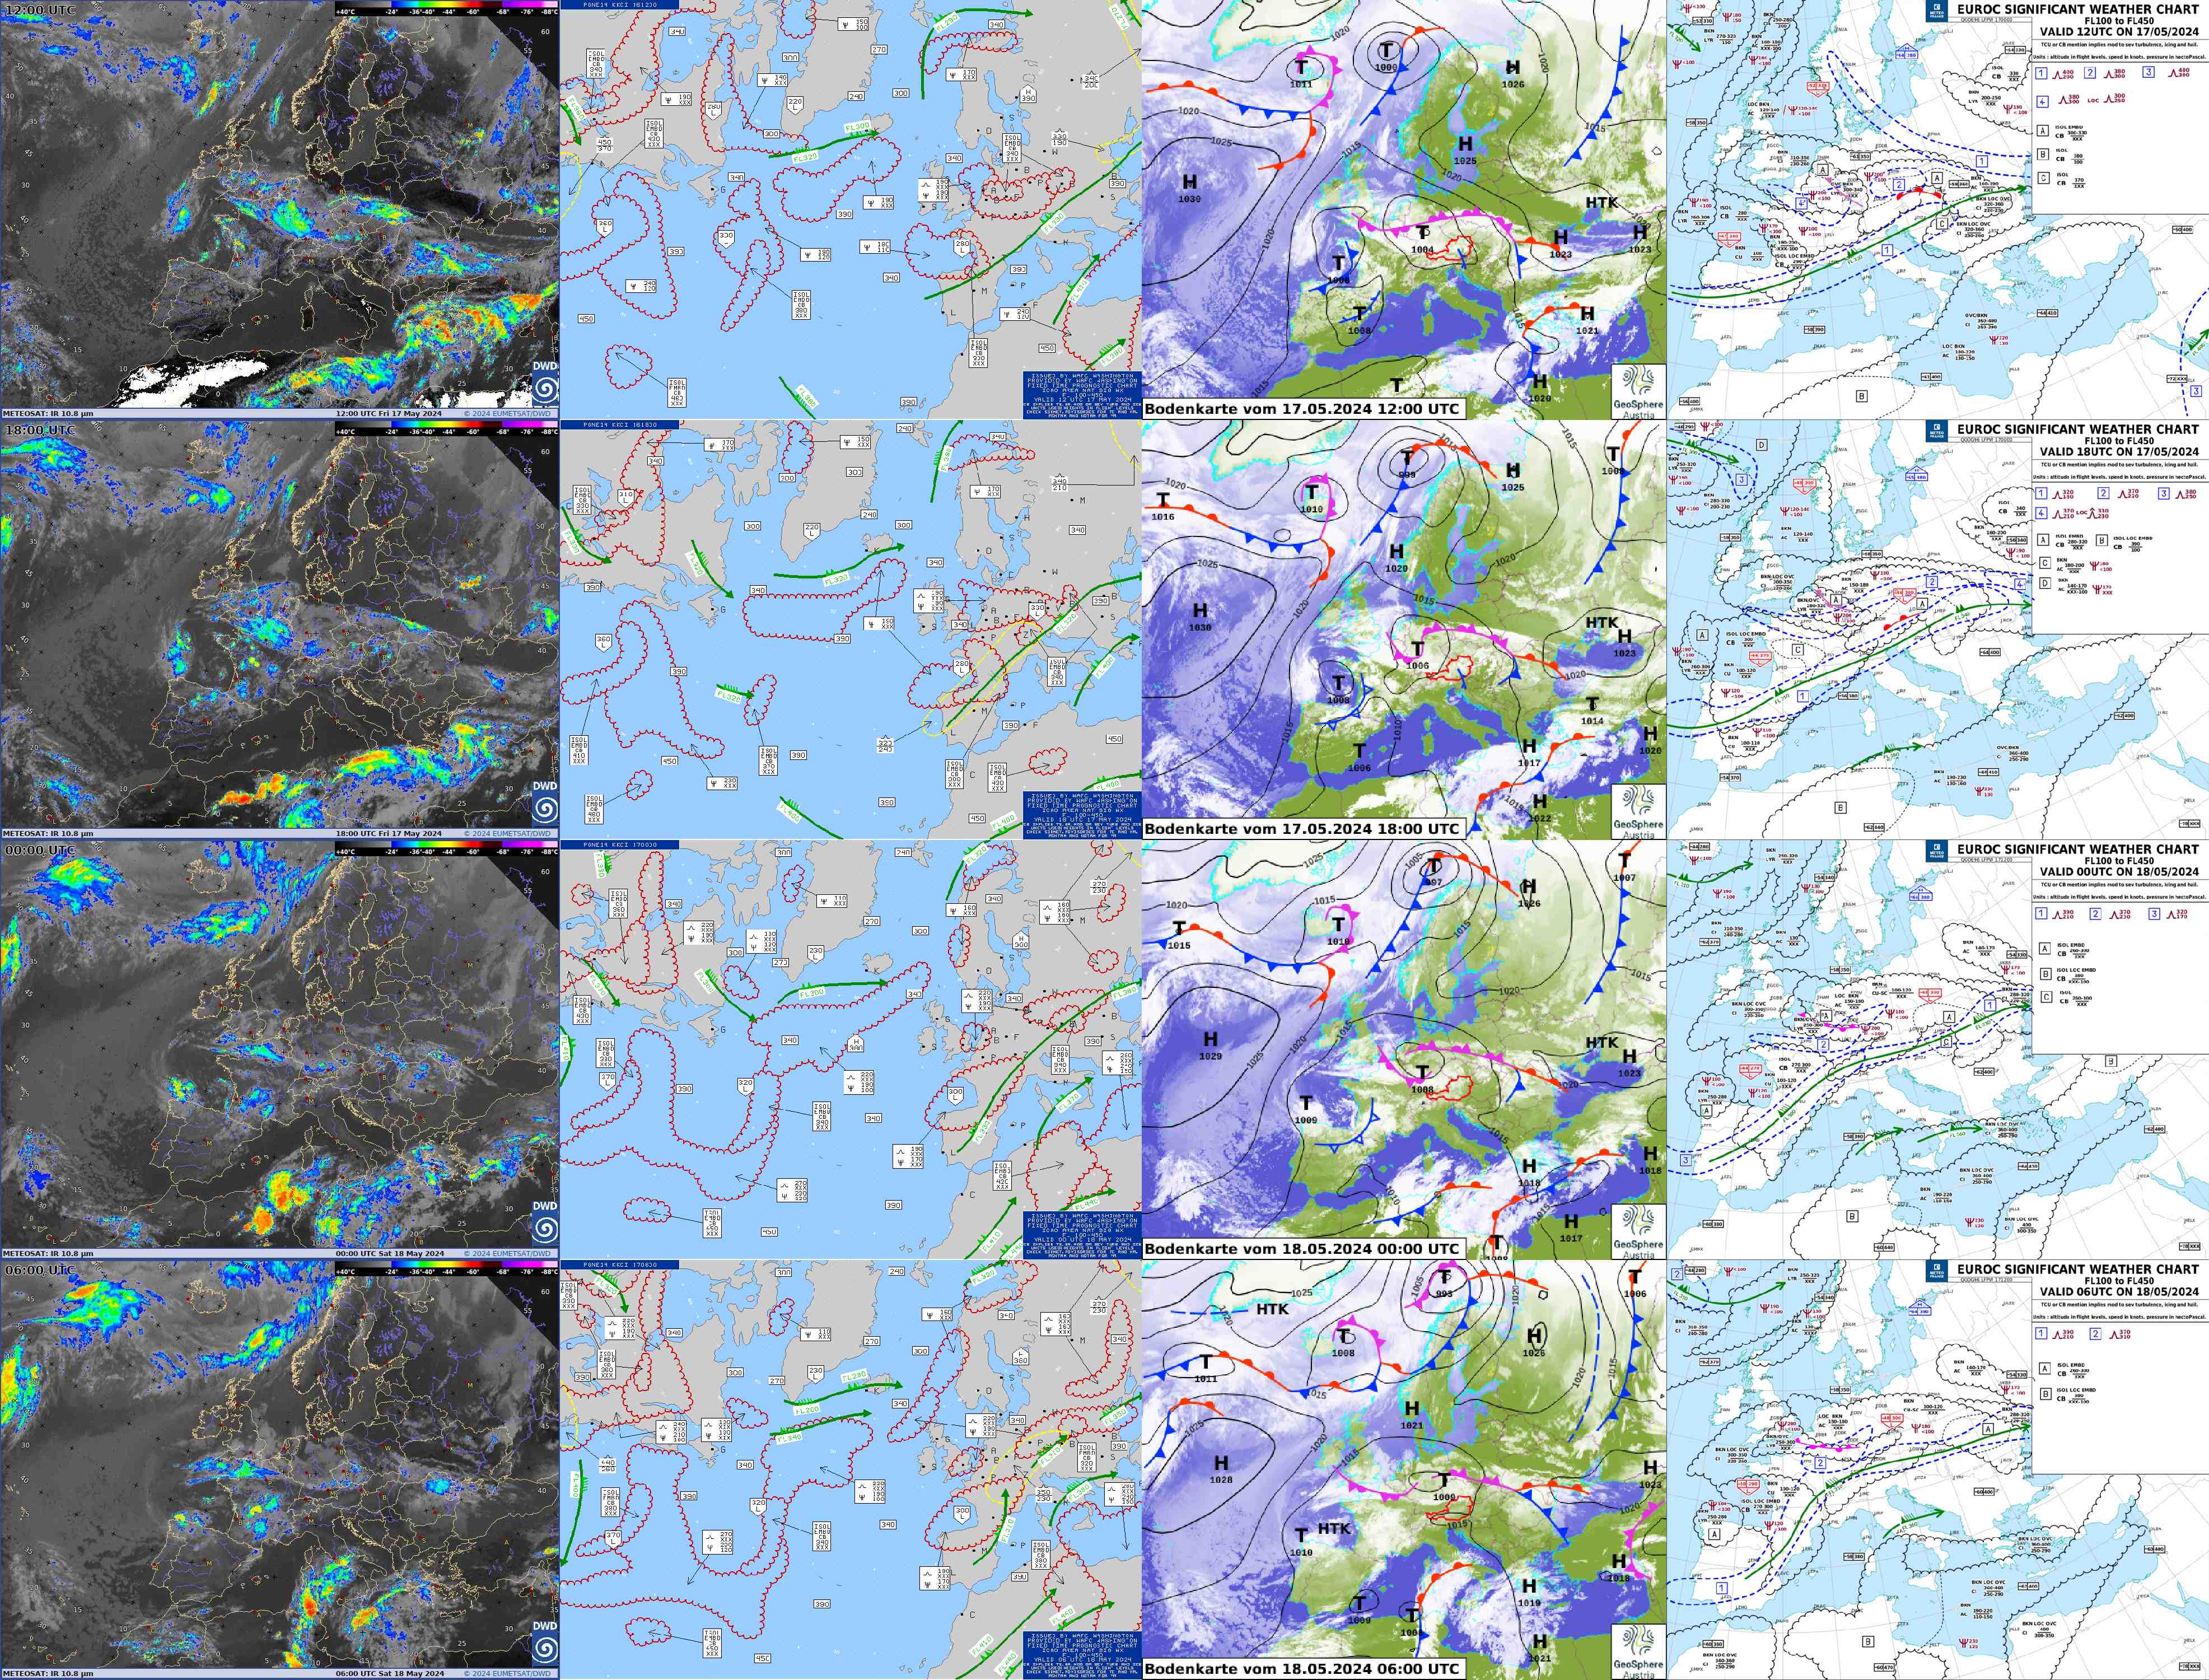
 SIGWX CHART vs MSLP Analysis
North Atlantic / South POLAR
WAFS
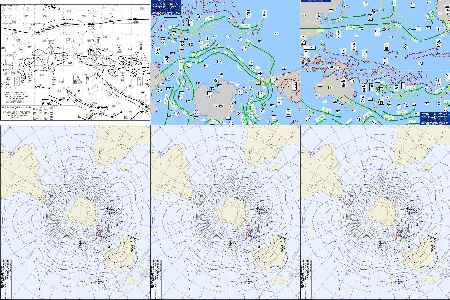
SWC NAT EUR
00Z
06Z
12Z
18Z
✔ How compare Significant Weather Chart vs MSLP Analysis / SAT aus?
✔ How are jetstreams crossing Lows and frontal systems?
✔ How did the jetstreams develop during the past 24 hours?
✔ How ist the 'Anticyclonic Perturbation Bow' runnein?
The Significant Weather Chart (SWC) shows meteorological phenomena above FL245
which frequently become a hazard to aviation, among others Embedded CB, ICE, TURB.
Also shown are the jetstreams with windspeed and direction.
While gridpoint winds for various flight-/pressure-levels are shown in
UPPER AIR Wind-/Temperature (W/T) Charts, the jetstream with
FLIGHTLEVEL und MAXWIND is shown in the SWVC.
The presentation of jetstreams compared to classical MSLP analysis with
SAT image illustrates the theoretically well known position of the
jetstream with respect to Lows with frontal systems - in the actual
weather situation. This visualization is available four time epr day.
 Warning Analysis and other
Links to websites with meteorological and hydrographical warnings in Germany, Europe and worldwide.
 10min Chart
Visualization of 10min-Values of German stations with climatological archive under special
consideration of extreme values
 Text
Text
 Text
Text
 Many charts and marine MET reports of the past week are available in the archive.
Miscellaneous
Various data and products are available under this topic.
 Text
Text
Browser Tips
Der Browser ist das Darstellungstool für alle Karten and Bilder - deswegen ist
es wichtig, ihn optimal einzustellen, um ihn schnell and einfach bedienen zu können.
F11 Vollbildmodus Umschalten - bei Kartenbetrachtung!
Strg+w Schliesst aktuellen Tab (Reiter) (Doppelklick auf den Tab)
Scrollen Gezoomte Karte mit der Maus bewegen (Panning)
➽Addon Scroll Anywhere (Chrome)
➽Addon Better Image Viewer (Firefox)
Wenn veraltete Dateien dargestellt werden, liegt das meist daran, dass diese noch im Browser Cache
sind, obwohl bereits neue Dateien hochgeladen wurden. Die folgenden Tips sollen helfen, das zu beheben.
Für Browser-Virtuosen ist das alles geschenkt - ich hab' einige Tips lange recherchiert...
Strg+F5 Daten neu laden (Refresh) (Chrome)
Strg+Umsch+Entf Browserverlauf löschen (Chrome)
Hotkeys CHROME
Besonders wichtig: Strg+Umsch+Entf Browserverlauf löschen (Chrome)
Sollten alte Daten angezeigt werden, ist das meist ein Cache-Problem des eigenen Browsers - dann
bitte Reload (wie oben beschrieben, je nach Browser) oder über die Einstellungen des Browsers
den gesamten Browserverlauf löschen. Wenn alles nicht hilft - kann das Problem auch bei mir
liegen ;-) ich bemühe mich zwar um einen stabilen Betrieb, aber: you never know ...
Anmerkungen zu 'old-style' Karten
Kritisch darf hier bemerkt werden, dass die Visualierung in dieser Umsetzung nicht dem
Standard des letzten Jahrhunderts entspricht - damals war sie besser!
Folgende Punkte zeugen entweder von Lieblosigkeit oder Unfähigkeit bei der Realisierung
dieser Karten:
1. Für die erste Seite (H+000 - H+036) hat wohl die Farbe zur Kolorierung der Temperatur-
bzw. Feuchtefelder nicht gereicht...
2. Dafür ist der Forecastschritt H+036 doppelt, sowohl auf dem H+000 - H+036 - Blatt als
auch auf dem Blatt H+036 - H+072. Das erhöht die Übersichtlichkeitt ungemein. Immerhin
kann man so schön den Unterschied zwischen unkoloriert (Blatt 1) und koloriert (Blatt 2)
erkennen. *
* Bitte diese Dppeldarstellung nicht auf dem zusammengestellten Bild-Array suchen - natürlich
wurde sie herausge-cropped.
3. Die Landkonturen der Vordrucke für die Farbversion für Temperatur 850 hPa sind leider
nicht zu erkennen - um dies besser zu zeigen, werden dann mal die Modelldaten
weggelassen.
An sich ein Fall für's You-may-believe-it-or-not-Museum... leider wahr.
 Klima
Klima
Impressum
 Text
Text
Text
Text
 Warnings
10min
Chart
Warnings
10min
Chart


 Hindcast
Array
Forecast
Hindcast
Array
Forecast
 Model Output Statistics